DRAFT
Gary, Indiana to Southern Kentucky
Snapshot: Length: 887 | Length in MAFC: 400 miles | Intersecting Interstates: I-10, I-20, I-24, I-40, I-59, I-64, I-70, I-71, I-74, I-80, I-85, I-90, I-94
I-65 is the major north-south route in the MAFC. I-65 begins in Gary, IN at exit 262 where it connects to Indiana Toll Road 1-90. I-65 traverses four states: Indiana, Kentucky, Tennessee, and Alabama. Its southern terminus intersects with I-10 in Mobile, AL.
I-65 along with I-75 serves as a border of the 100-mile wide “Auto Alley” home to a large number of automotive OEM and supplier firms that have facilities within an hour’s drive of these interstates. Some of the assembly plants sited along I-65 include Ford in Louisville, KY and General Motors in Bowling Green, KY.
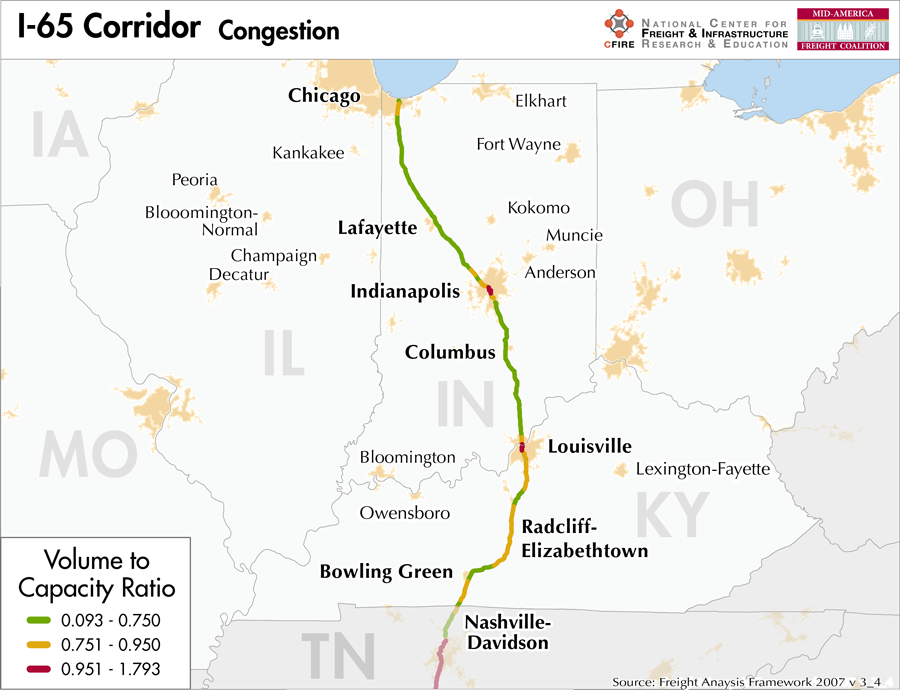
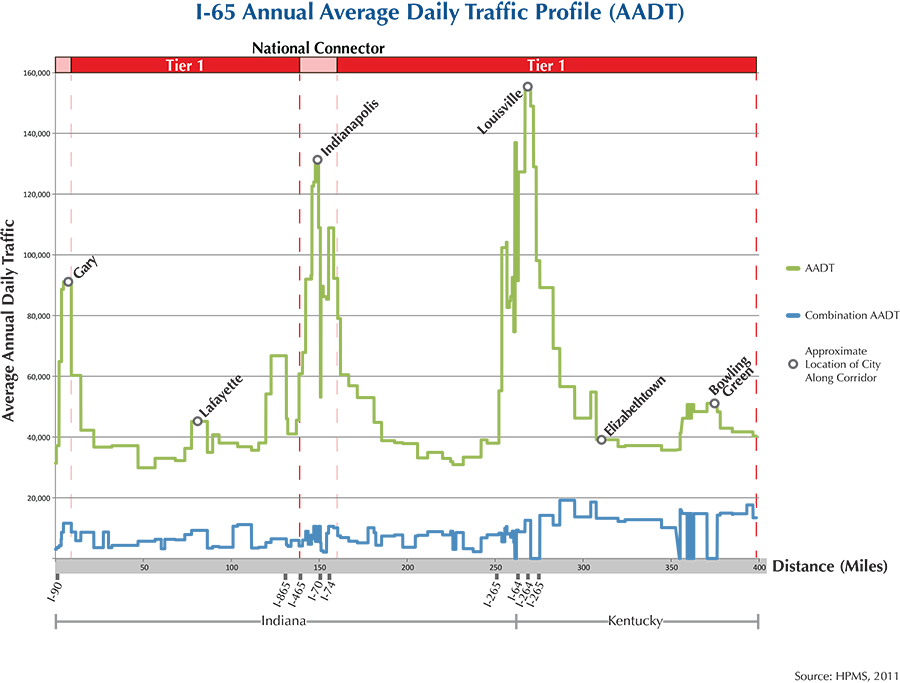
I-65 is considered a Tier 1 Corridor due the high number of trucks that travel over this route and because it serves as a major route out of the MAFC region to manufacturing facilities in the southern states. This corridor does not have a parallel rail freight line that can duplicate the function of I-65.
Indiana does not have a designated state truck route program. However based on state statutes, the truck freight network is composed of interstate highways, US highways, state routes, and other principal arterials, subject to the dimensions authorized and to local restrictions. The Statewide Posted Bridge Maps further classify which routes meet truck dimension clearances. Kentucky has identified a freight network, which includes I-65.
I-65 is not tolled in Indiana or Kentucky but has connections to a number of toll roads in northern Indiana: I-90 (entire length) and I-80/90 (Lake Station to Ohio state line).
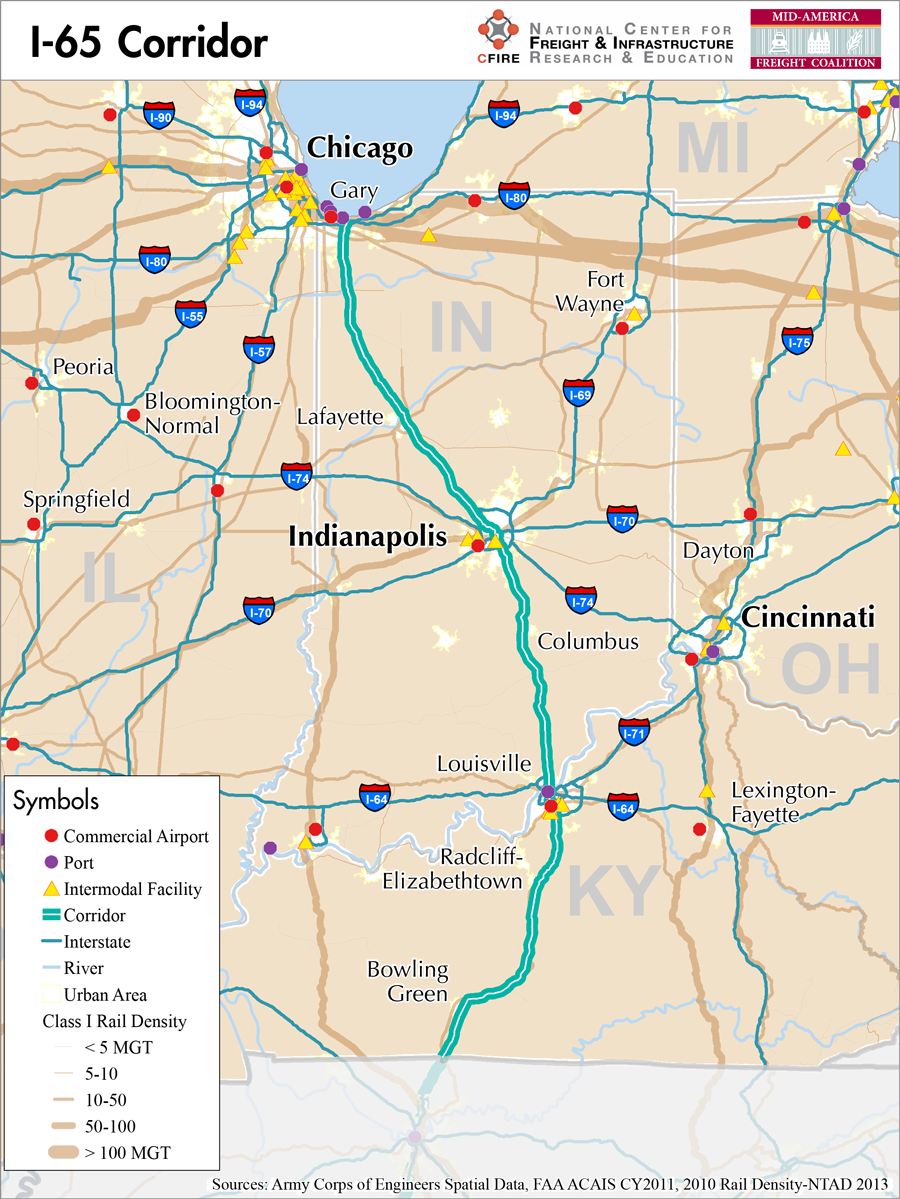
This corridor connects the Chicago MSA (3rd largest in the United States) to Indianapolis (33rd) and Louisville (44th).
Metropolitan Statistical Areas Economic Profile
| MSA | Population | GDP (2011, in millions) | Employment | Freight-related Employment | Metropolitan Planning Organizations |
| Chicago (IL) | 9,461,105 | $547,609 | 4,333,730 | 1,706,242 | Chicago Metropolitan Agency on Planning |
| Lafayette (IN) | 201,789 | $8,351 | 96,567 | 37,253 | Tippecanoe County Area Plan Commission |
| Indianapolis (IN) | 1,887,877 | $103,815 | 925,961 | 323,431 | Indianapolis MPO |
| Columbus (IN) | 76,794 | $4,719 | 38,860 | 20,555 | Columbus Area MPO |
| Louisville (KY-IN) | 1,235,708 | $5,588 | 46,893 | 18,573 | Kentuckiana Regional Planning and Development Agency |
| Elizabethtown (KY) | 148,338 | $5,588 | 46,893 | 18,573 | Lincoln Trail Area Development District |
| Bowling Green (KY) | 158,599 | $4,513 | 52,765 | 26,063 | Barren River Area Development District |
National Connectors
Chicago
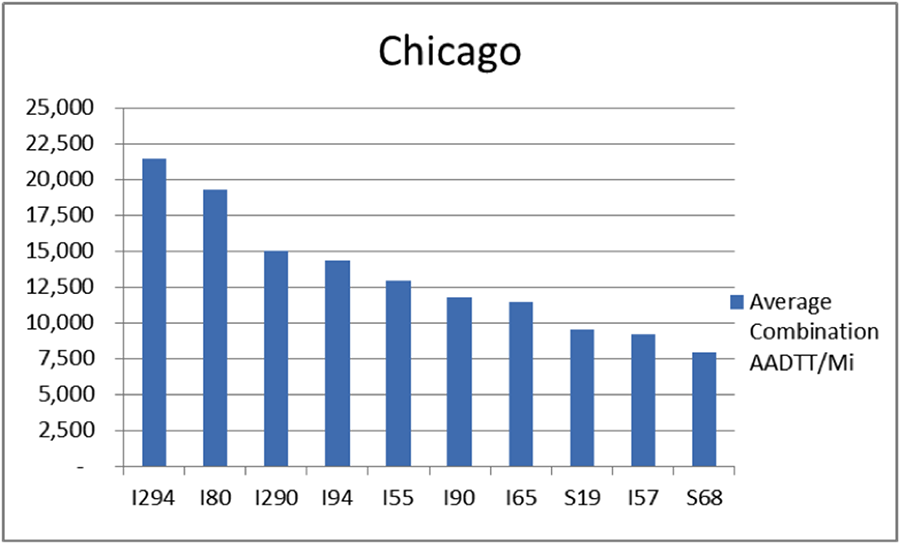
The interstates supporting freight originating in, destined for, and traveling through Chicago include I-55, I-57, I-88, I-89, I-90, and I-94. In total, Chicago has 42 urban interstates, freeways, and expressways that support freight movements. Chicago’s geographic location as a crossroad of numerous interstates causes a dispersion of freight throughout a large network of national connectors and interstates that travel through the city. The average combination AADTT per mile on Chicago’s urban interstates, freeways, and expressways is over 10,000 trucks for seven roadways and nearly 20,000 combination trucks for two roadways.
Indianapolis
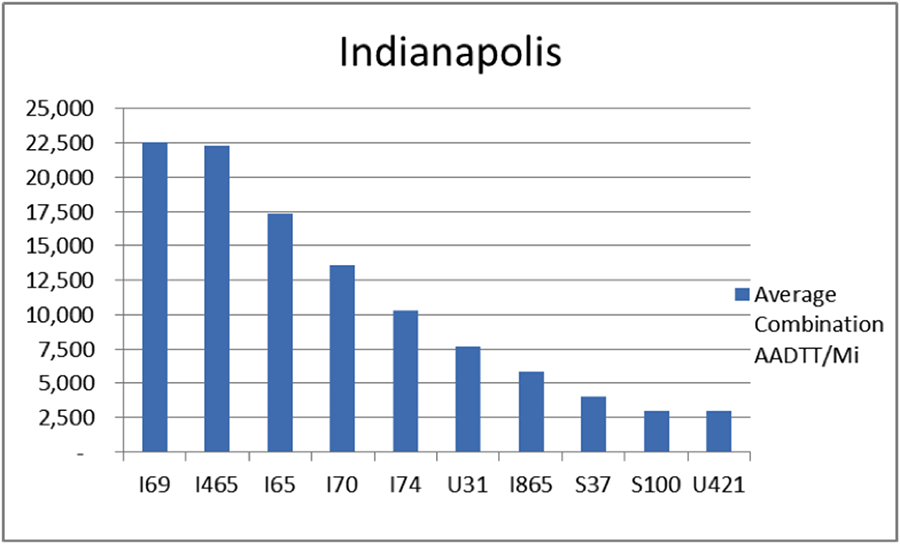
The interstates supporting freight originating in, destined for, and traveling through Indianapolis include I-74, I-70, I-65, I-70, and I-69. In total, Indianapolis has 12 urban interstates, freeways, and expressways that support freight movements. I-69, I-65, and I-70 rank one, three, and four respectively based on of the average combination AADTT per mile. Furthermore, I-69, I-65, and I-70 transport 58.5 percent of combination truck miles on urban interstates, freeways, and expressways within Indianapolis.
Louisville
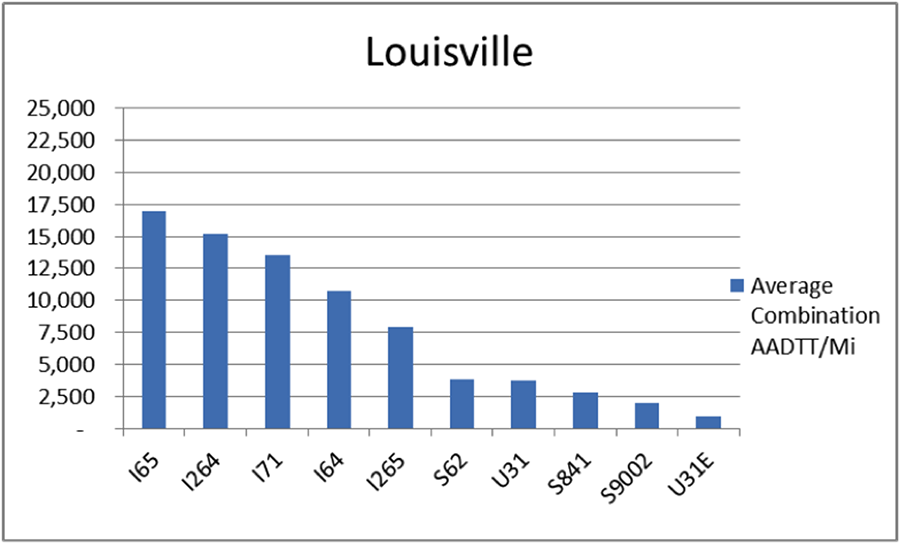
The roadways supporting freight originating in, destined for, and traveling through Louisville include I-64, I-65, and I-71. In total, Louisville has 11 urban interstates, freeways, and expressways that support freight movements. I-65, I-71, and I-64 rank one, three, and four respectively based on of the average combination AADTT per mile. Furthermore, I-64, I-65, and I-71 transport 76.7 percent of combination truck miles on urban interstates, freeways, and expressways within Louisville.
Freight Projects Impacting Truck Traffic
There are several projects along the I-65 corridor that will have important impacts on freight flows in the region.
- In Indiana and Illinois the Illiana Corridor has the potential to significantly improve the efficiency of freight transportation in the region. This project is a proposed alignment that will connect I-55 to I-65 to serve the burgeoning logistics centers developing in Will County, IL. This bi-state partnership seeks to relieve freight congestion on I-80 and I-94. This project will be developed with public-private financing.
- The Ohio River Bridges Project in Northern Kentucky-Southern Indiana will also significantly reduce congestion delays. The Indiana and Kentucky DOTs are collaborating to build two new bridges in the greater Louisville area that will significantly reduce both passenger and freight congestion. The Downtown Crossing will add six new northbound lanes on a new bridge, while the East End Crossing will connect the Indiana and Kentucky segments of the I-265 bypass allowing the movement of people and goods directly to the growing eastern portions of Louisville, while avoiding downtown congestion. The projects also include major reconstruction of the I-64/I-65/I-71 interchange in Louisville.
- The I-65/I-70 South Split Project in Indianapolis will close I-65 and I-70 on the east side of the city for approximately 59 days in order to lower pavement under seven bridges to allow clearances sufficient for oversize/overweight freight.
Truck Traffic
I-65 is a 398-mile corridor that crosses two states of the MAFC: Indiana and Kentucky.
- VMT 2007: 19,123,794
- Truck VMT 2007: 6,013,790
- Percent Truck VMT: 31.4 percent
Operational Efficiency (ITS)
The I-65 corridor has variable messaging boards (29) and camera coverage (94) along the corridor. A majority (60) of the cameras are located within the urban boundaries of Indianapolis (24) and Louisville (26). Additionally, 14 message boards are found within the urban boundary of Chicago and several others around Gary (3), Indianapolis (7), and Louisville (4). Message boards and cameras are clustered generally at the same locations around the urban area boundaries.
Indiana and Kentucky collaborate with Illinois and Ohio through ITS Midwest.
Greenhouse Gas Emissions
- Yearly tons of CO2 assuming 4 mpg: 3,400,000
- Yearly tons of CO2 assuming 7.5 mpg: 1,800,000
Methodology
- Data: Truck Counts (HPMS 2011)
- Assume 4 and 7.5 miles per gallon
- No control for level of service or elevation changes
- 22.3 lbs. of CO2 per gallon of diesel
Fuel and Truck Parking
| There are 40 fueling stations that also offer truck parking along I-65. One fueling station has less than 25 truck parking spaces, 14 have between 25 and 84 truck parking spaces, and 25 have more than 85 truck parking spaces. Compressed Natural Gas (CNG) and Liquefied Natural Gas (LNG) stations are listed to the right. | I-65 | CNG | LNG |
| Public | 7 | 0 | |
| Private | 3 | 0 | |
| Planned | 1 | 1 | |
| Total | 11 | 1 |
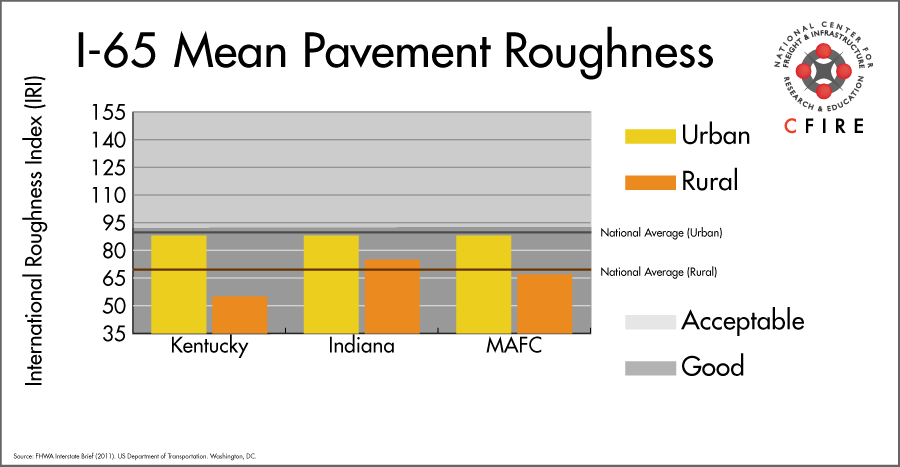
Infrastructure Condition
The International Roughness Index (IRI) measures the cumulative amount of vertical deviation (the bumpiness or roughness) for each segment of road, and is reported as a ratio in inches per mile. IRI values less than 95 are generally considered good, while values between 95 and 170 are generally considered acceptable. Since only corridor segments with reported IRI values from the 2011 HPMS dataset were considered in this analysis, some states may be missing from certain corridors.
The IRI is used as a measurement to determine infrastructure conditions within the Highway Performance Monitoring System (HPMS) such as pavement deterioration, pavement condition trends, cost allocation studies, and other analytical purposes. It is reported, at a minimum, for all road segments that fall under the Full Extent classification which includes the National Highway System (NHS), all principal arterials (interstates, freeways, and expressways), and rural minor arterials within the Sample Panel dataset. The data is collected by the states and submitted to the FHWA. The FHWA verifies the data, and houses it within the HPMS. For more historical information, see MnDOT’s Introduction to the International Roughness Index.
Freight Facilities
Intermodal Terminals
- Norfolk Southern (NS) Buechel – Louisville TOFC/COFC
- NS Appliance Park – Louisville: COFC
- Indiana Railroad (INRD) – Indianapolis: COFC
Major Rail Yards
- Avon Yard: Indianapolis
- Osborn Yard: Louisville
Airports
- Gary/Chicago International (GYY)
- Indianapolis International (IND)
- Louisville International (SDF)
Ports
- Gary, IN
- Louisville, KY
Automotive Facilities
- Louisville, KY – KTP/LAPP/Strawberry Yard
- Lafayete, IN: Suburu- CSX, NS
Freight Rail
Freight rail density over 100 million gross tons (MGT) is only seen north of the northern termini of I-65 over the CSX Barr Subdivision. Lines carrying less than 99 MGT run east/west. The only truly parallel rail route runs from Louisville to Nashville along the CSX Mainline Subdivision with density less than 40 MGT.
Emerging Intermodal
The Indiana Railroad opened a new intermodal terminal in downtown Indianapolis in June 2013 and will offer intermodal service over the Canadian National Railway to the port of Vancouver and Prince Rupert. An estimate on the facility’s capacity is unknown at this time.
Passenger Rail
The Cardinal (three weekly trips to New York) and the Hoosier State runs from Chicago to Indianapolis (196 miles) over the CSX Lafayette Subdivision. The line zig zags over I-65. Freight traffic is light with no more than 20 MGT according to 2010 density data reported in the 2013 National Transportation Atlas Database. Several FRA-designated high-speed rail corridor segments are located within Indiana and are therefore eligible for financial assistance. The corridors include Chicago/Detroit, Chicago/Indianapolis/Cincinnati, Chicago/Cleveland, and Chicago/Indianapolis/Louisville. These corridors however do not follow the I-65 alignment.
Airports
There are two air cargo airports on the I-65 Corridor.
- SDF in Louisville is the top ranked commercial airport in the MAFC region in terms of landed weight (2012). It is ranked 3rd overall in the nation only behind Memphis, TN and Anchorage, AK. It is considered a primary hub airport, is home to UPS Worldport, and is also serviced by a FedEx Express air cargo facility.
- IND in Indianapolis is the second ranked commercial airport in the MAFC region and fifth nationally in terms of landed weight (2012). It too is considered a primary hub airport, and is serviced with facilities for both UPS and FedEx Express.
| Louisville International-Standiford Field (SDF) | Indianapolis International (IND) | |
| Cargo Facilities | Domestic Cargo Only, Mechanical Handling, Heated Storage, Dangerous Goods, Express/Courier Centre, Parking space for large transient aircraft is very limited. | Bonded Warehouse, Free Port/Foreign Trade Zone, Aircraft Maintenance, Express/Courier Centre |
| Cargo Terminals | 1 | 4 |
| Number of Runways (max. length) | 3 (10,849 feet) | 3 (11,200 feet) |
| Warehouses & DCs within 5/10 miles | 19 / 48 | 16 / 34 |
| Air Cargo Businesses within Urban Area | 283 | 533 |
| 2011 Landed Weight (lbs.) | 10,981,281,067 | 4,813,314,835 |
| 2010 Landed Weight (lbs.) | 10,637,700,120 | 4,717,295,655 |
| Change (Percentage) | 3.23% | 2.04% |
| Intermodal Connectors (5/10 miles) | 4 / 11 | 8 / 9 |
Ports and Marine Highways
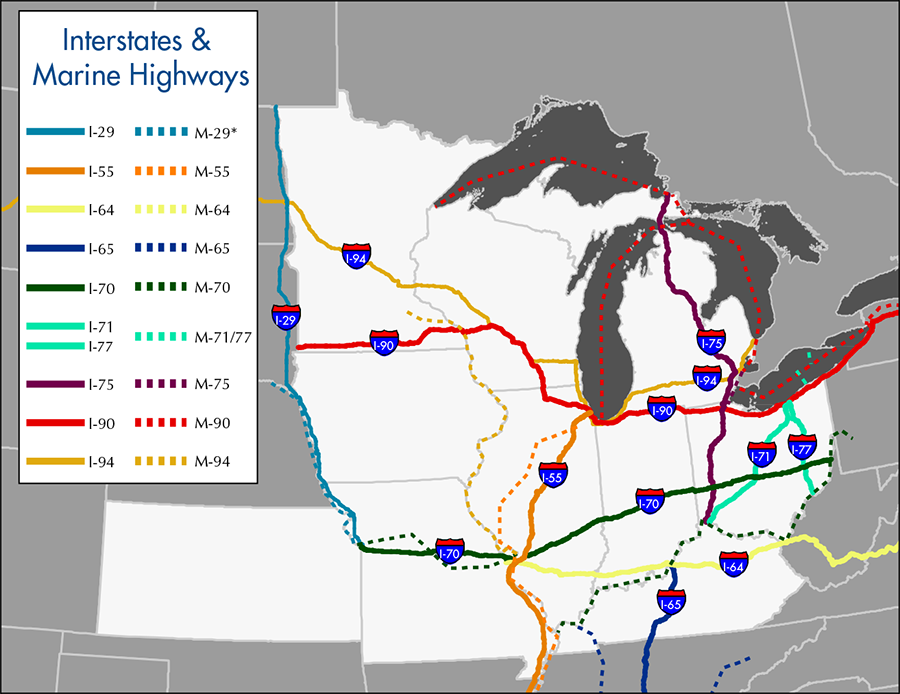
M-65, which consists of the Tennessee River and the Tennessee-Tombigbee Waterway, is the designated Marine Highway reliever route between Louisville, KY and Mobile, AL. M-65 is equipped with 600 foot locks and provides continuous water access to the rest of the inland Marine Highway system to the north and the Gulf intercoastal waterway at Mobile. Freight traveling between Louisville and Mobile could access M-65 from a number of major ports including Louisville, KY; Mt. Vernon, IN; Nashville, TN; Chattanooga, TN; and Mobile, AL. In addition, numerous smaller ports and terminals provide potential access between I-65 and M-65.
Freight Generators, Warehouses, and Distribution Centers
There are a total of 17,993 freight generators employing 321,927 people within three miles of the I-65 corridor, and a total of 37,509 freight generators employing 647,889 people within 10 miles of the corridor. If the extent of analysis focuses on the metropolitan statistical areas (MSAs) intersected by the I-65 corridor, there are a total of 152,003 freight generators employing 2,380,257 people. Within the MSAs, there are a total of 517 warehousing and distribution centers employing 14,853 people. Freight generators were determined by using the NAICS codes prescribed for freight-related sectors in NCFRP Report 19, and include agriculture, mining, manufacturing, wholesale trade, retail trade, transportation and warehousing, and eating and drinking places.
Major Manufacturers |
Major Distribution Centers |
|
|
References
- FHWA Interstate Brief (2011). US Department of Transportation.