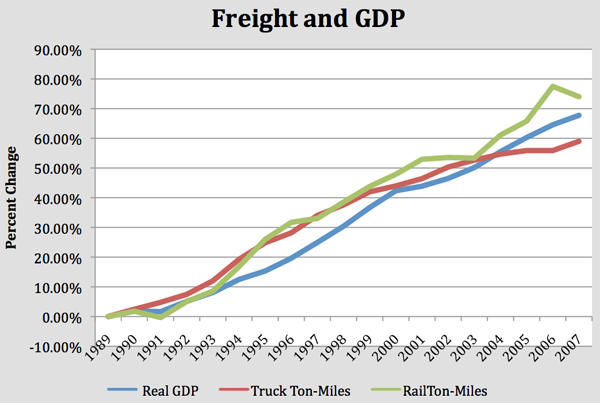
The world economy depends on the efficient movement of freight. There is a strong correlation, for example, between truck and rail ton-miles of travel and real gross domestic product (Figure 1). Analogous correlations exist between other freight measures—tonnage of freight or diesel fuel consumption—and GDP.
Transportation and logistics also consume a significant proportion of each of our budgets. The freight logistics system costs nearly $4,500 per person, which is spent moving and warehousing goods (Figure 2).

This $4,500 factors into the cost of every product we buy. Anything that industry or government can do to make the logistics system more efficient will return benefits to us in terms of lower cost and greater global competiveness.
Transportation accounts for more than ten percent of our total economy (Figure 3). This percentage includes the costs of personal transportation as well as freight. It clearly highlights the significant role that transportation plays in our society and the heavy responsibility of those who manage transportation facilities.

Supply Chains
Supply chains are the mechanisms by which products and the raw materials from which products are made move from their source to the consumer. In recent decades, supply chains have become much more sophisticated. In part, this is because they are often longer: raw materials, components, and finished products now often move between continents before reaching the consumer. In part, it is also because businesses have become much more concerned about the efficient management of those chains. They have come to understand that the competition is not between individual businesses, but between supply chains that may include many businesses. The supply chain that is most efficient will be able to deliver a product to the consumer at the lowest cost.
At one time, the typical management structure was what was known as push-logistics. Under this management approach, manufacturing facilities and distribution centers simply shipped what had been produced to the retailer and hoped they would sell the product. The result was often large inventories and losses due to obsolescence, both of which increased the cost to businesses. Pull-logistics was introduced as a response to these costs. As the name implies, pull-logistics uses inventory management and communications systems to determine when additional product is needed and to signal back through the supply chain to trigger its delivery, and, in many cases, its production.
Considering a simple, frequently used product provides another way to understand supply chains and the importance of freight. A study funded by the American Association of State Highway and Transportation Officials (AASHTO) illustrated the long and winding road followed by a box of cereal. The trip begins in the wheat fields of the central part of the nation. The wheat is then stored, processed, distributed in its processed form, and then sent to retail centers where it is sold to the customer (Figure 4).

Kansas is a major producer of beef, accounting for 17 percent of the nation’s total output. Each year 3.7 million cattle are finished on 369 feedlots in Kansas. Many of the animals and much of the feed are imported from other states. The finished products are sold across the nation and the world. A complex, multi-modal supply chain moves both the raw materials and the finished products (Figure 5).

A souvenir t-shirt of the sort that we might buy on vacation requires an even longer global supply chain. Pietra Rivoli traced the history of a t-shirt she bought in Fort Lauderdale, Florida. It was a typical beach scene t-shirt, but she was surprised to find that it was born in Lubbock, Texas, took form in Shanghai, China, and was finished in Miami, Florida (Figure 6).

The supply chain for a Boeing Dreamliner is much more complex, using components from ten countries and nineteen companies (Figure 7).

The Dreamliner supply chain (Figure 7) was a major change for Boeing. Nearly all of its previous planes had been purely American products, with some components, particularly wing design, held very closely within the company. Apparently, Boeing found outsourcing was needed to control costs and to gain acceptance of the product from the very competitive international marketplace.
Every product we buy is created through and delivered by a supply chain. The efficiency of that supply chain will have a large impact on the price we pay for that product. The efficiency of a product’s supply chain also has a significant impact on how the companies involved that supply chain compete for future business.
Many of the actions that determine the efficiency of a supply chain fall within the realm of the private sector, but many are also influenced by public policy and investment decisions. As those decisions are made, public sector leaders need to be aware of their impacts on the efficiency of supply chains.
Current and Future Challenges
The Federal Highway Administration has forecast a continued and accelerated growth in freight traffic over the next twenty-plus years. Current highway congestion will grow, in part, because of greater numbers of trucks. Figure 8 illustrates the change in the composition of highway traffic over the past twenty-five years. Until the early 1990s, overall traffic and large combination trucks changed at roughly the same rate. Since that time, the growth of trucks has been faster than that of overall traffic.

If this trend continues, and the growth in overall freight demand predicted by the FHWA is correct, highway congestion will increase well beyond current levels. Figure 9 is a map showing the FHWA’s estimate of highway congestion—assuming nothing extraordinary is done—in 2035.

Many major corridors in Mid-America will be clogged. Some of those are in essentially rural areas—I-94 in central Wisconsin, I-80 through much of Iowa, I-35 South of Minneapolis, and I-65 North of Indianapolis.
Coping with this congestion will also require much more attention to bottlenecks. Figure 10 illustrates only interchange bottlenecks—and does not account for signalized intersections, lane drops and grades or the projected growth in congestion.

Some argue that the solution to this challenge is modal shift—greater use of rail and maritime transportation and less trucking. However, this modal shift brings its own problems. Figure 11 gives a prediction of future rail congestion from a study done for the Association of American Railroads. According to this study, many routes will be operating beyond their current capacity by 2035. Many of these routes are in the Midwest, including most that hub on Chicago, as well as the Wyoming coal trains.

Our maritime transportation routes—rivers and Great Lakes—do not suffer from the same type of impending congestion. They do suffer from antiquated infrastructure. The major lock that allows thousand foot lakers to move from Lake Superior to the lower Lakes is aging and must be replaced. Similarly, many of the locks and dams on the Upper Mississippi, Ohio and Illinois Rivers were built in the 1930s or even earlier. Many are in need of major repair. Many are so small that barge tows must be disassembled to pass through.
Regardless of the mode—whether truck, rail, or water—major investments will be required to provide the needed capacity.
Modal Split
The central question about modal split is whether trucks will continue to carry the major share of our products. A recent AASHTO study considered current and projected modal split using three measures: tonnage, value, and ton-miles.
According to this study, trucks will gain modal share in both tonnage and value, while both rail and water will gain share in ton-miles (Figures 12 and 13). The increased share of ton-miles by rail and water can be attributed to the importance of bulk commodities typically moved by water and rail and to the growing importance of truck-rail intermodal on long hauls.


Drivers of Growth in Freight
We might also consider whether the forecasted growth in freight will actually happen. Based on recent trends and other forecasts, the answer again seems to be yes. AASHTO identified four major drivers of freight demand: consumption, production, trade, and supply chain management.
Consumption and production are closely related. As the population grows, consumption will increase. As our population grows, our economy grows to supply the product, services, and jobs that population requires. The US population was 308 million in 2010 and is expected to reach 420 million by 2050. Over the past twenty years, our economy has grown by more than 50 percent (Figure 14). During the same period, the population increased by 59 million people.

As consumption increases, so does production. Some of this production will take place abroad, but much of it will take place in the United States. All of it will require the movement of raw materials, intermediate products, and final products. More stuff requires more freight movement.
International trade is an increasingly important part of our economy. The total value of our imports and exports is equal to between 25 and 30 percent of GDP. With the exception of the recent economic downturn, that percentage is increasing (Figure 15).

The economic downturn in 2009 is clearly a short-term anomaly (Figure 16). Both imports and exports continued the 2010 growth trend. Figure 16 also illustrates a concern for US policymakers. The gap between imports and exports is large and negative.

The growth in trade is a global phenomenon (Figures 17 and 18).

The United States, China, and Germany lead the world in exports (Figure 17). The importance of exports from the oil producing countries of the Middle East, most notably Saudi Arabia, remains steady.

The majority of exports to the United States come from either North America or the Asian Pacific Rim (Figure 18). More than three-quarters of the exports of Canada and Mexico end up in the United States. Many Asian countries—with China being the foremost—rely on the United States as the destination for between ten and twenty percent of their exports.
Modern supply chain management, as we’ve already noted, seeks to minimize overall costs by creating the most efficient supply chain for a given product. Inventory and transportation make up most of these costs. However, transportation is not the dominant cost factor. Inventory costs—capital, shrinkage, administration, and obsolescence—often account for 25 percent of the cost of a product.
To minimize inventory costs, manufacturers, warehouses, and retailers seek to minimize operating inventory. Manufacturers use just-in-time delivery, where the components move directly from the truck to the assembly line. Warehouses and retailers to use pull logistics, asking for just the amount of product that will be sold in the near future. As a result, transportation is substituted for inventory. More frequent deliveries allow lower inventory levels. The truckload delivery gives way to the partial truckload, and the partial truckload gives way to the package van. The result is more freight vehicles covering more miles to carry the same overall loads.
All of these factors—increased consumption, increased production, increased global trade, and modern supply chain management—create growth in freight transportation.
Key Points
- Ton-miles of freight moved correlates closely with changes in gross domestic product (GDP).
- Logistics (transportation and warehousing) costs our economy nearly $4,500 per person per year.
- The transportation sector accounts for more than 10 percent of the US economy.
- Supply chains compete for market share, increasing the importance of efficiency in the overall system.
- The keys to supply chain efficiency lie in both the private and public sectors.
- The volume of freight can be expected to grow over the coming decades, causing greater congestion on our highways and railroads.
- The trucking sector will see a slight growth in its share of overall tons and value.
- Rail and water will see a slight increase in their share of ton-miles.
- The increase in freight is driven by several factors:
- As our population grows, consumption and production increase. The US population is projected to increase from 308 million in 2010 to 420 million in 2050.
- International trade is a growing component of our economy.
- Modern supply chain management strategies substitute transportation for inventory, increasing the number of trips.
References
- Association of American Railroads Statistics and Publications.
- AASHTO. Transportation Reboot.
- Bureau of Transportation Statistics. Freight Transportation: Global Highlights.
- Bureau of Transportation Statistics. National Transportation Statistics.
- FHWA. Economic and Social Characteristics of the United States: 1980-2007.
- FHWA. Freight Facts and Figures.
- FHWA. Freight Transportation Today.
- FHWA. The Freight Story: Congestion.
- Guo, Jessica. An Assessment of Multimodal Freight Bottlenecks and Alleviation Strategies for the Upper Midwest Region. The Mississippi Valley Freight Coalition, 2010.
- Murphy, Richard. Supply Chain Logistics – Post Recovery Landscape.
- Rivoli, Pietra. The Travels of a T-Shirt in the Global Economy. John Wiley and Sons, 2005.
- US Census Bureau. Foreign Trade Statistics.
- US Census Bureau. Transportation: All Modes.
- Wittwer, Ernie. Logistics for the Public Sector.