MAFC Industry and Jobs
The Mid-America Freight Coalition’s regional economy plays an integral role in the functioning of the nation’s economy. Overall, the region’s economy is responsible for approximately 20.45 percent of the nation’s gross domestic product (GDP). It is home to almost a third of the nation’s agricultural, forestry, fishing, and hunting production, and home to more than a quarter of the manufactured products as well as the management of our nation’s businesses.
Table 1: MAFC GDP as a Percentage of US GDP
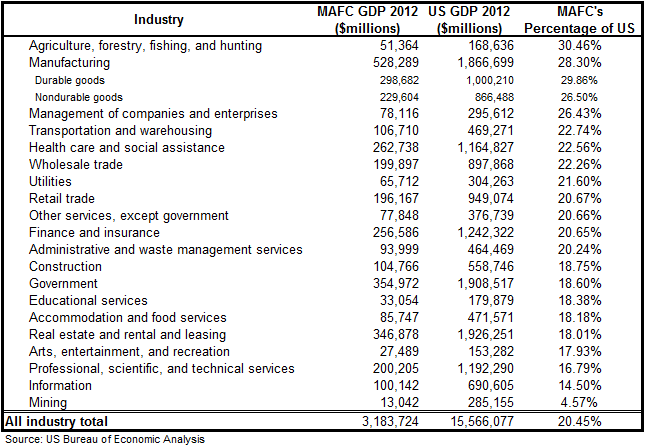
While the size of the transportation and warehousing sector does not make up a considerable amount of the economy, it was roughly 3.35 percent of the MAFC economy in 2012 and 3.02 percent of the US economy. The firms in the transportation and warehousing sector indirectly impact the rest of the economy by providing transportation and storage services for the economy’s goods and services. Freight transportation is derived demand: as the amount of goods and services created increases, so too does the need to move those goods and services. And as the services provided by the transportation and warehousing sector become more efficient, the economy is beneficially impacted.
Particular attention in this overview will be given to the manufacturing industry for a number of reasons. First, as per NCFRP Report 17, the manufacturing sector consumes a large portion of the services provided by the transportation and warehousing sector in the United States. It is a freight intense industry.
Secondly, from an economic perspective, the manufacturing sector is a driver industry. In order to make products, companies must purchase raw materials, intermediate goods, and various services from other businesses. According to the National Association of Manufacturers, the manufacturing sector has the highest average multiplier of any sector in the economy at 1.48. For every dollar spent in manufacturing activities another $1.48 is added to the economy.
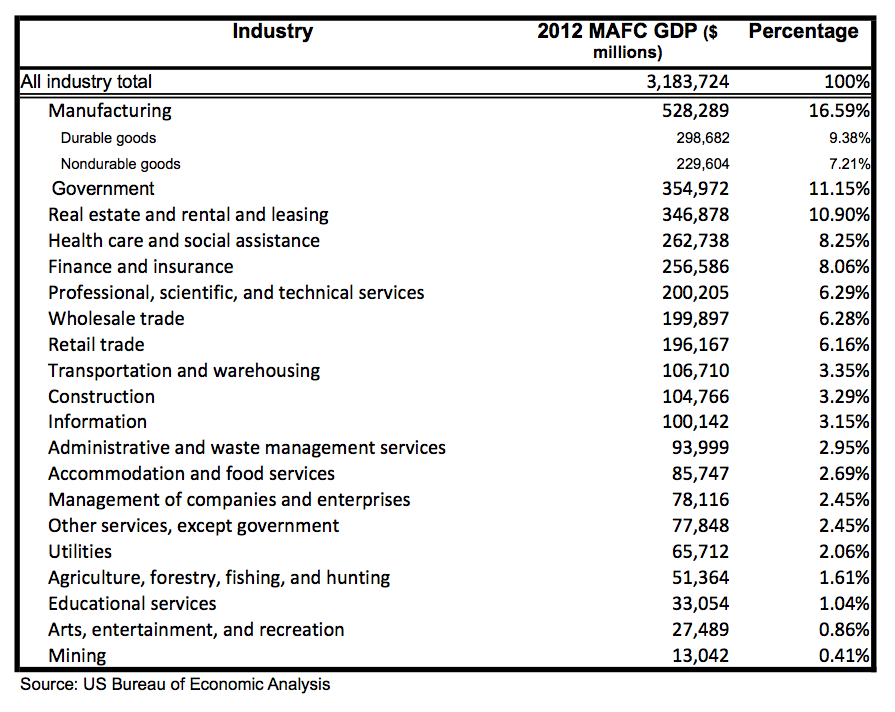
Thirdly, the manufacturing sector is the largest private industry sector within the MAFC’s economy when measured by production in dollars. Bureau of Economic Analysis data for 2012 puts its percentage of the MAFC economy at 16.59 percent, while the amount of economic activity within the entire United States devoted to manufacturing in 2012 was roughly 12 percent. If the production of goods is broken down into durable and nondurable, the production of durable goods alone would be the third largest industry in the region.
Table 2: Economic Output Per Industry in the MAFC
GDP totals at the industry sector level for the MAFC and each state of the MAFC between 1997 and 2012 can be found here.
Not only does the manufacturing industry represent a large number jobs and output in absolute terms, but the sector is even more important to the MAFC region in relative terms. The US Department of Commerce released a report in January of 2013 titled, The Geographic Concentration of Manufacturing Across the United States. The report found that “although almost all states include some counties where manufacturing accounts for a significant share of jobs and earnings, such counties are concentrated in the Midwest and the South, are more likely to be outside metropolitan areas, and are relatively small.” The importance of manufacturing to the MAFC states is highlighted by the fact they filled out the top six spots when ranking by manufacturing’s share of total earnings within the economy and place seven out of the top ten when ranking by manufacturing’s share of total employment.
Table 3: Manufacturing’s Share of Total Earnings and Employment
| Earnings | Employment | |||
| Indiana | 22.3% | Indiana | 13.1% | |
| Wisconsin | 20.2% | Wisconsin | 12.9% | |
| Iowa | 17.6% | Iowa | 10.6% | |
| Michigan | 16.8% | Arkansas | 10.6% | |
| Ohio | 16.0% | Ohio | 10.0% | |
| Kansas | 14.9% | Michigan | 9.9% | |
| Alabama | 14.8% | Alabama | 9.8% | |
| Arkansas | 14.6% | Mississippi | 9.4% | |
| South Carolina | 14.6% | Kansas | 9.2% | |
| New Hampshire | 14.5% | Kentucky | 9.2% | |
| National Average | 9.9% | National Average | 7.0% |
Source: US Department of Commerce
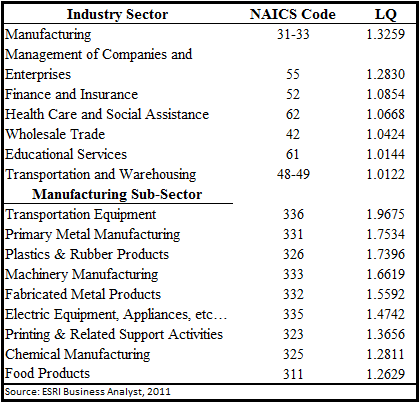
Another way to measure the relative values is by utilizing Location Quotients (LQs). LQs are used to compare the economic make-up of a smaller geographical area to that of a base geographical area (larger and encompassing). Most of the time, comparisons are made to the US economy as a whole versus a census track, zip code, county, metropolitan statistical area (MSA) boundary, or state. LQs greater than one represent an economy that is more concentrated in a particular industry/sector than the base economy and less than one being less concentrated. Employment figures are most often used (as is the case in this study), but output figures can be used as well. MAFC industry sectors and manufacturing subsectors with the highest LQs are shown below. Within the MAFC, manufacturing has the highest LQ of all industrial sectors. LQs for all industry sectors and certain subsectors for the MAFC and each state, along with underlying employment numbers, can be found here.
Table 4: Location Quotients Per Industry Sector in the MAFC
It should be noted that the range in a given LQ value increases as the geographic extent in question becomes smaller (for example moving from a multi-state region such as the MAFC to individual states, from states to counties, from counties to zip codes, etc.). The classification of economic activity also becomes more specific (manufacturing versus transportation equipment manufacturing, as seen above).
While the manufacturing of transportation equipment at the MAFC regional level registers an LQ of 1.9675, the highest LQ registered by an MAFC state comes in at 4.6615 (Michigan). This makes sense as localities specialize in different economic activities and do so due to limited natural resources, capital, and labor. Figure 1 shows the transportation equipment manufacturing LQs for counties within the MAFC. The LQ values range from a low of zero (no transportation equipment manufacturing in the county) to a high of 40.7113.
Figure 1: Transportation Equipment Manufacturing Location Quotients in the MAFC

However, location quotient based maps unrealistically present data as being homogeneous within preset geographical boundaries, and cannot provide precise spatial analysis that individual point data can. Employment density maps for the manufacturing subsectors in the MAFC were created to bridge the gap between the LQ choropleth maps and the proprietary ESRI business point data. These maps are not intended to be an in-depth analysis, but rather an initial step by identifying the geographic locations where clustering opportunities exist based on specific industrial activity. Point densities were calculated for 50, 20, and 10 mile areas so that as the map extent changes (larger or smaller) the spatial analysis matches the change.
The Global Manufacturing Backdrop
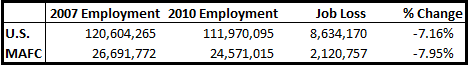
The Great Recession (December 2007–June 2009) was the largest downturn in US economic history since the Great Depression. The United States has since struggled to post economic growth it had grown accustomed to prior to the recession. This new normal has proven to provide lower growth, and has been accompanied by unfamiliar unemployment rates (the US unemployment rate has only recently dipped below 8 percent, where it hovered above since February of 2009). According to County Business Pattern (CBP) data, the MAFC region lost roughly eight percent of its employment between March of 2007 and March of 2010. The loss in growth and employment not only left a profound mark on the private sector, but also the public sector. The subsequent combination of a decrease in revenue from taxes, particularly income and property due to the loss of jobs and the housing bust, and an increase in government assistance outlays have instilled a renewed focus on economic development, job growth, and overall economic competitiveness at all levels of government.
Table 5: US and MAFC Recession Job Losses
The recent economic downturn, however, should not be viewed in isolation. Rather, it should be considered in tandem with other global trends. In particular, the offshoring of US manufacturing production to China has had far-reaching impacts to the US and MAFC economy.
China’s Gain
With a vast and flexible pool of cheap labor and government subsidies in the form of tax incentives, cheap industrial land, incredible amounts of infrastructure investments, relaxed regulations, and an undervalued currency, China created the perfect recipe to lure manufacturing activity from all parts of the world. In his TD Economics report, Offshoring, Onshoring, and the Rebirth of American Manufacturing, Michael Dolega writes about China’s roots as a producer predominately of low value and labor-intensive goods in the early 1980s through the mid-1990s. During this period, 60 percent of US imports from China were of the low-value-added nature and only 25 percent consisted of higher value goods such as machinery, electrical equipment, and computers and electronics. By the end of the century however, China had slowly transitioned itself into a more balanced exporter to the United States with the breakdown of exported low-value-added to high-value-added goods at 42 percent and 38 percent respectively.
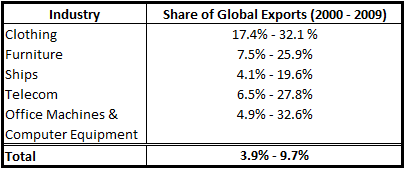
China’s admittance to the World Trade Organization (WTO) brought with it a reduction in the tariffs imposed on Chinese imports, and set the stage for China’s explosive ascension to a global export leader. In its August of 2011 report, Made in America, Again, the Boston Consulting Group reported that between 2000 and 2009, Chinese exports increased nearly five times to over $1.2 trillion, and almost tripled its share of global exports. While its global share of clothing exports almost doubled, the increases in market share within higher value added industries are most notable (Table 6).
Table 6: Chinese Share of Global Exports
The United States’ Loss
Since around the turn of the century, while China was experiencing unprecedented growth in its manufacturing sectors, the United States bore witness to the other side of the globalization coin to the tune of roughly 6 million manufacturing jobs lost. Manufacturing jobs from the MAFC accounted for approximately 2 million plus of those job losses. Charles Fishman’s The Insourcing Boom uses the history of General Electric’s Appliance Park to mirror the decline and recent revitalization of American manufacturing. Highlights in the timeline for the Louisville, KY plant are below:
- 1951-GE’s Appliance Park designed with a dedicated power plant, zip code, and fire department
- 1955-Employment reaches 16,000
- 1960s-Production equals 60,000 appliances per week
- 1973-Employment peaks at 23,000
- 1984-Employment falls below 1955 level
- Early 1990s-GE CEO Jack Welch suggests Appliance Park will be shuttered by 2003
- 2011-Appliance Park employs 1,863
- February 2012 to Present-New high-end appliance assembly lines. Appliance Park employs 3,600 hourly works and 500 designers and engineers.
A shift share analysis using County Business Pattern (CBP) data for the MAFC’s economy suggests the offshoring trend and recent recession had a significant impact on the region. The analysis indicates that had the region’s economy mirrored that of the national economy, we could have expected the MAFC economy to gain almost 2 million jobs between 2003 and 2008 and lost about 225,000 jobs between 2003 and 2008. Instead, the region lost roughly 300,000 and 2.5 million. It also implies the region’s economy is weighted towards industries losing employment, and the regional industries are somewhat less competitive than the national average.
A Manufacturing Renaissance
As finance fades into the backdrop, manufacturing takes center stage, and each hometown accomplishment brings crucial carryover effects for the surrounding economy. It’s not being overly dramatic to say that the world is on the verge of a new industrial revolution as manufacturing regains its traditional role as a global growth driver. Manufacturing’s share of global output is 17.4 percent, the highest it’s been in over a decade. – Rana Foroorhar
Factors that once caused the outflow or offshoring of American manufacturing production and associated jobs such as labor cost arbitrage, low transportation costs, and the declining costs of capital, are now reversing course. These factors, coupled with a domestic energy boom, an increased awareness of hidden costs associated with expanded supply chains, and recent technological innovations, have prompted a debate regarding the positioning of global manufacturing. Whether it is termed reshoring, nearsourcing, homesourcing, localnomics, or economic gardening, there is a growing consciousness regarding the manufacturing renaissance taking place in the United States. Transportation professionals should take note not only because reshoring serves as an opportunity to create economic growth by increasing production of goods here in the United States (which will inevitably be influenced by the transportation system’s level of efficiency), but also because it has the ability to drastically change and shape the geography of freight and ultimately impact the transportation system.
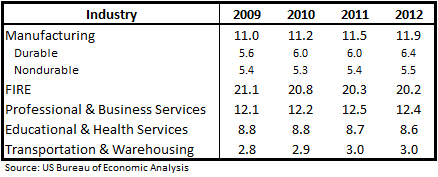
Despite the loss manufacturing jobs between 1998 and 2010, economic data suggests the sector is leading the rest of the economy out of the Great Recession having added approximately 500,000 plus jobs. In addition to the growth in employment, the manufacturing sector grew at a year over year rate of 6.2 percent between 2011 and 2012, and accounted for 11.9 percent of the US GDP in 2012. November 2013 commentary from the Federal Reserve and its district banks suggests continued expansion in manufacturing activity highlighted by the motor vehicle and other high technology industries.
Table 7: Real Value Added by Industry Group
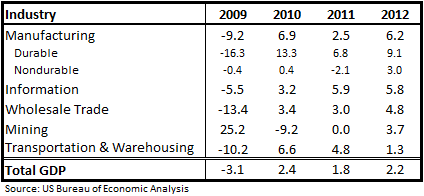
Table 8: Value Added By Industry Group as a Percentage of GDP
A spreadsheet with value added by industry group (percent change and as a percentage of GDP) for all industries can be found here.
Whether or not the recent gains in manufacturing employment and activity is a structural shift pointing to a renaissance here in the United States (due to newly discovered competitive advantages) or rather just a cyclical recovery (the recovery in jobs and output is as expected at this point of the economic recovery) has been a point of disagreement between economists and those in the media. Unfortunately, at this point in time we have no way of knowing. We are left to conjecture with the small sample of quarterly economic data (summarized above), the factors in favor of reshoring, a number of surveys, which have attempted to ascertain companies’ plans in regards to future production placement, and anecdotal evidence.
Besides General Electric, other companies who have recently moved manufacturing activities to the US include blue chips like Apple, BASF, Caterpillar, Dow Chemicals, Ford, GE, Google, Walmart, Whirlpool, and many other companies large and small. The Reshoring Initiative provides a library of reshoring case studies regarding companies of all sizes.
The MAFC’s strength in manufacturing activities referenced earlier, particularly those subsectors that are primed to be reshored, will provide its states opportunities to take advantage of the reshoring trend. It does not guarantee that the region’s offshored production will be replaced in the same quantity with reshored production, but the fact that similar activity is already located here provides producers the prospect of benefitting from the agglomeration/clustering of activities via shared technologies, labor, raw materials and other inputs, as well as transportation, logistics, and infrastructure.
A common critique regarding the reshoring trend and associated employment gains however is that the increasing capital intensity in the manufacturing process is driving down the need/use/demand for human labor. In other words, because the jobs that have been and will be reshored are not the same and not in the same quantities as those that were originally offshored, don’t expect reshoring to be a cure all for what ills the economy.
The US manufacturing output and employment data presented in the figure below supports this critique, as does anecdotal evidence from activity already reshored. In The Insourcing Boom, Charles Fishman writes about GE’s recent experience with reshoring:
And of course, manufacturing employment will never again be as central to the U.S. economy as it was in the 1960s and 70s–improvements in worker productivity alone ensure that. Back in the 60s, Appliance Park was turning out 250,000 appliances a month. The assembly lines there today are turning out almost as many–with at most one-third of the workers.
Figure 2: Manufacturing Output versus Employment
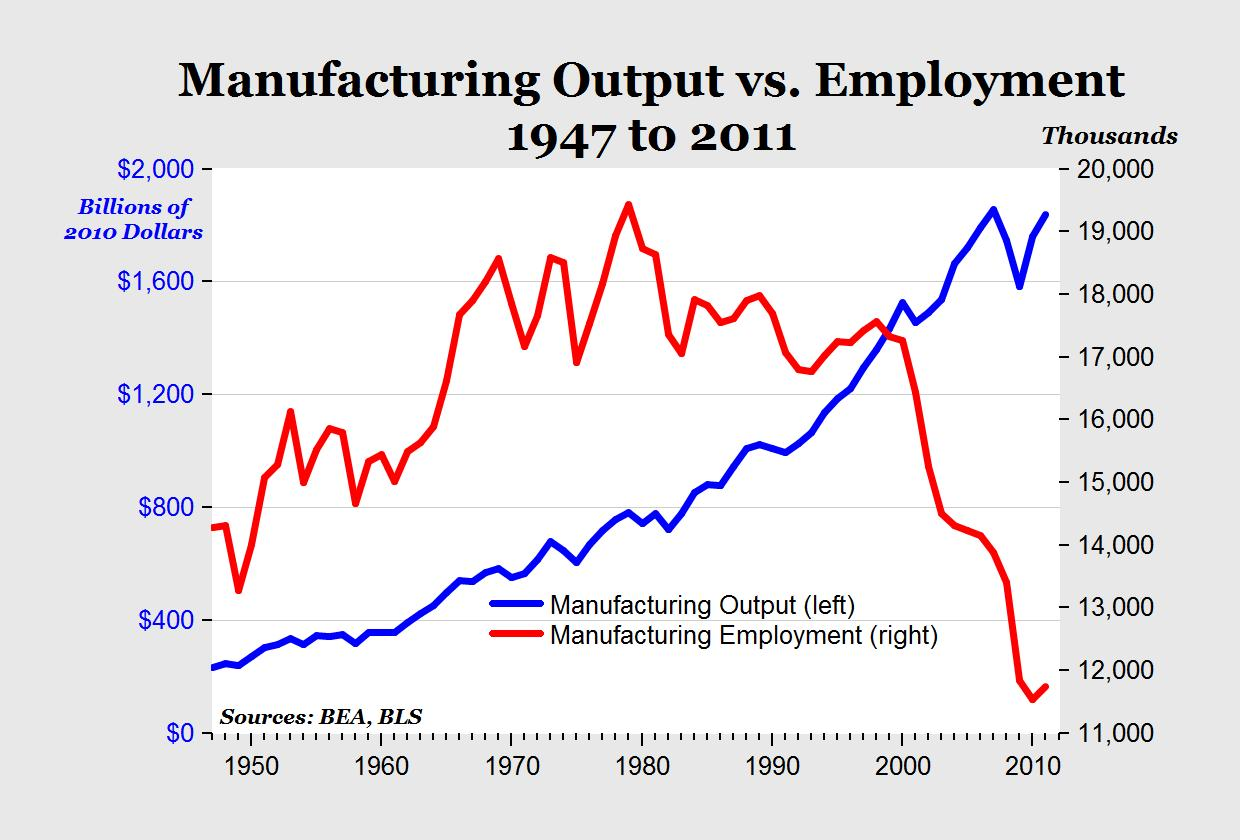
Source: Phenomenal Gains in Manufacturing Productivity
The data and Fishman may be correct in terms of the overall employment make-up of the US economy (manufacturing’s percentage of jobs within in the economy), but manufacturing’s multiplier of 1.48 is still central to and a driving force for the US economy via its forward and backward linkages to other industries. This point cannot be stressed enough. Not only does GE create jobs when it places production activity here in the United States, it also encourages other business to do the same. As explained by Fishman:
All that said, big factories have a way of creating larger economies around them—they have a “multiplier effect,” in economic parlance. Revere Plastics Systems, one of GE’s suppliers, has opened a new factory just 20 minutes north of Appliance Park, across the Ohio River in Indiana, and has 195 people there working in three shifts around the clock.
Transportation’s Role in Economic Development: A Changing Perspective
Fifteen years ago, the clusters theory popularized by Michael Porter was born while at the same time globalization was firmly taking root. The combination of global labor wage rate disparities and cheap transportation costs caused companies to disregard locational advantages in favor of offshoring production.
Although location remains fundamental to competition, its role today differs vastly from a generation ago. In an era when competition was driven heavily by input costs, locations with some important endowment–a natural harbor, for example, or a supply of cheap labor–often enjoyed a comparative advantage that was both competitively decisive and persistent over time. Competition in today’s economy is far more dynamic. Companies can mitigate many input-cost disadvantages through global sourcing, rendering the old notion of comparative advantage less relevant. Instead, competitive advantage rests on making more productive use of inputs, which requires continual innovation.
Fast forward to the present day, where a reversal in the factors that once favored offshoring have reintroduced the importance of location, endowments such as harbors, and multi-modal transportation networks into the production location decision-making process. While continual innovation will continue to play a key role in determining competitive advantages, we are again at a time when transportation infrastructure can provide locations with a comparative advantage.
Policy Guidance and Overall Framework
During his 2010 State of the Union address, President Obama committed the United States to focused efforts regarding American exports and established a goal of doubling its exports by 2015. According to the National Export Initiative (NEI), “The Obama Administration has made it a top priority to improve the conditions that directly affect the private sector’s ability to export, working to remove trade barriers abroad, help firms of all sized and farmers overcome hurdles to entering new markets, and assist with financing.”
The NEI reports that US exports reached all-time highs in 2012 valued at $2.2 trillion while supporting 9.8 million jobs. Not only are US exports of goods and services reaching historic levels, but also are doing so while outpacing imports in dollar terms and percentage change—the first time since 2007. In total, 29 states reached record export levels in 2012. Manufacturing (a 47 percent increase between 2009 and 2012) and agriculture (a 38 percent increase over 2011) are both realizing substantial gains.
It is interesting to note there was no mention of transportation’s role in the NEI, and no one from the transportation community was named to the NEI panel. While economic development is not solely a transportation issue, transportation plays a key role as businesses and farmers rely upon our nation’s transportation infrastructure to export their goods. The US Congress and US DOT have realized the ancillary yet crucial role transportation plays in making US goods competitive globally, and with MAP-21 have set out to successfully support economic competitiveness by integrating transportation’s perspective, expertise, and network of relationships alongside other departmental agendas (agriculture, commerce, education, energy, labor, homeland security, treasury, etc.).
MAP-21 established the goal for the National Freight Policy to invest in infrastructure improvements that among other things: strengthen the contribution of the National Freight Network to the economic competitiveness of the United States, increase productivity for business, and improve the economic efficiency of the National Freight Network. Instances pertaining to ‘economic competitiveness’ within MAP-21 are itemized here.
States are strongly encouraged to create state freight plans and form state Freight Advisory Committees (FACs) to garner non-DOT perspectives. While policy, framework, and guidance is created at the federal level and flows from the top-down, the responsibility for creating economic growth and solutions to transportation issues reside with the states and ultimately with agencies and organizations at the local level including: regional planning commissions (RPCs), metropolitan planning organizations (MPOs), counties, cities, economic development organizations, chambers of commerce, and private businesses. In the end, transportation and government officials would be wise to heed the advice set out by Leo Penne at TRB’s 2013 Annual Meeting: the functionality of freight plans can only be accomplished when they are integrated into the planning processes at the state, regional, and local levels; no two states are alike, and neither will the freight plans or implementations of those freight plans.
For US manufacturers, profitability will be a direct result of how efficiently their processes can be run. Efficiency doesn’t begin or end at the manufacturing plant’s property lines; rather it extends through the supply chain. In order for companies to achieve profitability, world-class transportation infrastructure must be in place to provide companies with the ability to get raw materials and intermediate goods in the back door and finished products out the front door delivered to market. Organizations and entities such as DOTs must recognize the variable nature associated with the economics of freight, seek out input from those with the local knowledge, and collaborate with the various organizations and entities that govern and support US manufacturers (commerce, labor, education, agriculture, homeland security, and treasury). Ultimately, by treating freight as a unique customer segment, DOTs will be best suited to do their part by making effective long-term infrastructure investments keeping US industries globally competitive.