Table 1 summarizes the volume of the Mississippi River System and Great Lakes Navigation System waterways compared to the total volume of US maritime freight. In 2010, the total volume by weight of US waterborne freight traffic (both domestic and foreign) was more than 2.3 billion short tons. The combined maritime traffic in the Mississippi River System (MRS) and the Great Lakes together accounted for more than a third of all waterborne freight traffic by weight.
Table 1: Domestic and Foreign Maritime Freight: US, MRS, GLNS 2010
| United States | Mississippi River System | Great Lakes | ||||||
| Short Tons (millions) | Percent of US Total | Short Ton (millions) | Percent of US Total | Short Tons (millions) | Percent of US Total | |||
| Total | 2,334 | 100% | Total | 662 | 28% | Total | 130 | 6% |
| Foreign | 1,441 | 62% | Foreign | 187 | 8% | Foreign | 41 | 2% |
| Domestic | 893 | 38% | Domestic | 474 | 20% | Domestic | 89 | 4% |
| Internal Domestic | 448 | 19% | ||||||
Sources: Waterborne Commerce of the United States Part 5 – National Summaries Calendar Year 2010, Table 1-1; Table 3-1; Table 3-10
Table 2 shows the volume of foreign trade imported and exported in the MRS and GLNS in 2010 compared to the US total, and how they changed from the ten-year average. In 2010, the nation was still recovering from a severe recession.
Table 2: Foreign Maritime Imports and Exports: US, MRS, GLNS 2010
| Foreign Maritime Freight – Comparison of Imports and Exports United States, Mississippi River System, Great Lakes (Millions of Short Tons) |
||||||||||
| United States | Mississippi River System | Great Lakes | ||||||||
| Inbound | Outbound | Inbound | Outbound | Inbound | Outbound | |||||
| Total 2010 | 883 | 558 | Total 2010 | 72 | 116 | Total 2010 | 16.7 | 24.2 | ||
| Average ’01-‘10 | 1,002 | 446 | Average ’01-‘10 | 84 | 97 | Average ’01-‘10 | 22 | 32.9 | ||
Sources: Waterborne Commerce of the United States Part 5 – National Summaries Calendar Year 2010, Table 1-2; Table 3-1; Table 3-10
Table 3 lists the top commodities shipped in the two waterways. Compared to oceanic ports directly engaged in international trade, US domestic waterways are used almost exclusively to carry relatively lower value-to-weight bulk commodities.
Maritime shipping of higher value-to-weight products such as large manufactured equipment and containerized goods is almost exclusively limited to coastal ports. As a result, the dollar value of commodities handled at MRS and GLNS ports represents a smaller percentage of the total value of commodities handled at US ports than the maritime tonnage totals indicate.
However, monetary value of commodities handled is not the sole measure of total economic value of maritime shipping to the local, state, or regional economy. The value of maritime shipping can also be measured in the cost savings to shippers, customers, governments, and society. Maritime shipping is more fuel efficient and less labor- and infrastructure-intensive per ton-mile than rail or trucks. It can also impose fewer social costs in the form of harmful emissions and accidents. Domestic waterborne shipping directly and indirectly supports jobs, firm revenues, and government revenues regardless of the cargo.
Bulk materials shipped within the MAFC region and elsewhere in the domestic maritime network are vital to value-added industries with strong economic multiplier effects. For example, iron ore, limestone, and coal shipping in the Great Lakes is vital to US steel production and manufacturing. Grain commodities shipped from MAFC ports provide feed for US meat industries outside of the region. Domestic waterways are used to ship fossil fuels and chemicals that sustain economic activity throughout the region.
Table 3: Top Maritime Commodities: US, MRS, GLNS 2010
| Mississippi River System | Great Lakes | |||||
| Internal Domestic (millions of tons) | Coastal Domestic (millions of tons) | Foreign (millions of tons) | Domestic (millions of tons) | Foreign (millions of tons) | ||
| Total | 448.4 | 25.6 | 188.9 | 88.6 | 40.9 | |
| Coal | 162.0 | 5.5 | 9.7 | 21.7 | 9.2 | |
| Petroleum and Petro Products | 74.2 | 16.1 | 61.3 | 1.6 | 2.2 | |
| Chemicals (Fertilizers, Other) | 36.8 | 1.4 | 17.3 | .1 | .5 | |
| Crude Materials* | 81.5 | 2.3 | 14.8 | 61.4 | 22.4 | |
| Food and Farm Products | 73.7 | .6 | 77.9 | .5 | 2.9 | |
| Primary Manufactured Goods | <.1 | 0 | <.1 | 3.2 | 3.5 | |
| Other | 1.1 | .0 | 1.0 | .2 | .2 | |
*Major subcategories of Crude Materials include Iron Ore, Iron, and Scrap; Sand, Gravel, Clay, Salt, and Slag; Non Ferrous Ores and Scrap; and Lumber, Logs, Chips, and Pulp.
Sources: Waterborne Commerce of the United States Part 5 – National Summaries Calendar Year 2010, Table 3-4, Table 3-10
MAFC Commercial Ports
The US Army Corps of Engineers maintains infrastructure and channels at more than 900 ports and harbors throughout the United States (Figure 1). It maintains 140 ports in the Great Lakes alone, 63 of which are deep-water (authorized depth of 27.5 feet) commercial ports. The remaining ports are shallow-draft recreational ports with authorized depths of less than 14 feet. Most Great Lakes ports are in the MAFC region.
On the IWS, the World Port Source lists more than 102 commercial ports on navigable rivers throughout the Mississippi River Basin, including at least 29 in the MAFC region. In addition, numerous smaller barge terminals–many serving a single firm or customer–are located along the riverways.
Figure 1: Federal Commercial Ports
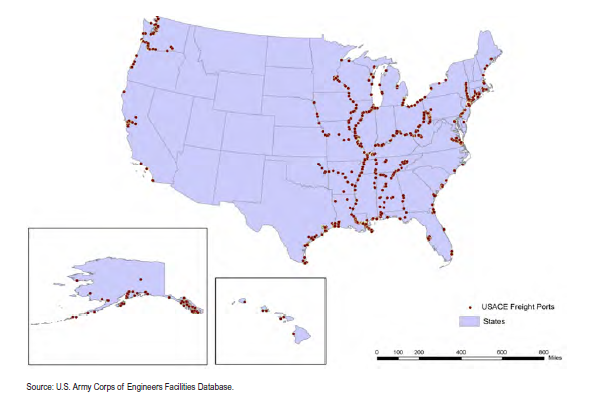
Source: Waterborne Freight Transportation Bottom Line Report
Some of the largest US ports measured by volume of freight handled are located in the MAFC region. Of the nation’s busiest 150 ports, 34 are located in the GLNS and 25 in the MRS. All but one of the large Great Lakes ports (Buffalo, New York) are located in MAFC states. Because, maritime trade in the MRS is more dispersed, fewer of the region’s river ports are among the nation’s largest ports. Nevertheless, river ports at St. Louis, Cincinnati, and other MAFC ports are nationally significant. Only the deep-water, international ports in Louisiana and the coal shipping ports of Huntington, West Virginia (which lies partly in Ohio) and Pittsburg, Pennsylvania are busier. The fact that commercial maritime shipping on the MRS is not concentrated in large ports is an advantage to many shippers because it reduces distances to port and avoids congested urban corridors.
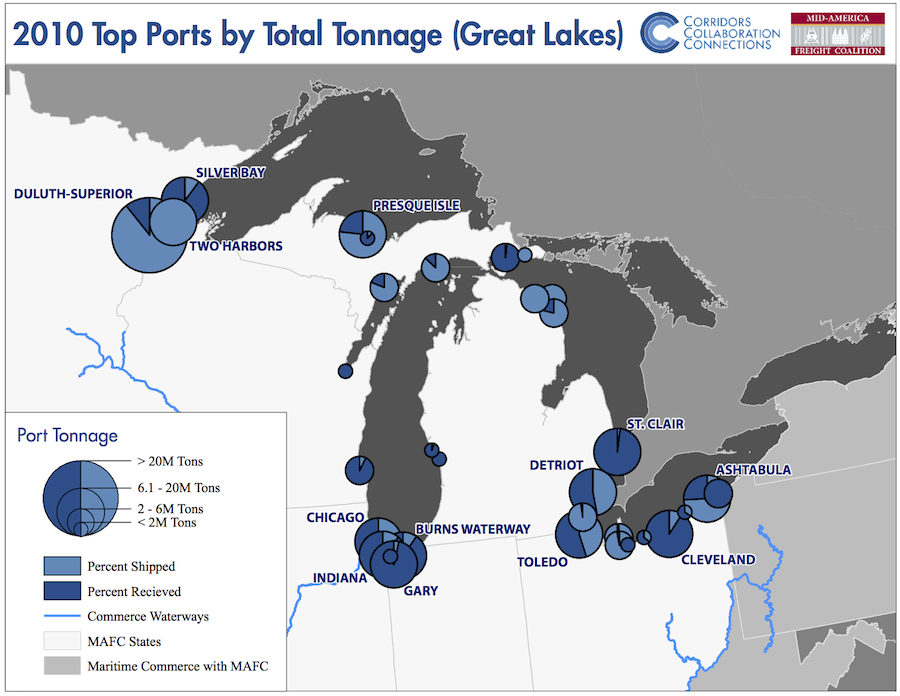
Table 4 shows the number of MAFC ports that are among the top 150 US ports in terms of tonnage in 2010. Table 5 and Table 6 list the largest ports in the MRS and GLNS respectively, along with their respective national rank and total, domestic, and foreign tonnage handled in 2010. Figure 2 and Figure 3 illustrate the location and the total tonnage for the largest ports in the MRS and GLNS.
Table 4: Top 150 Ports: US, MRS, GLNS 2010
| Summary of Top Ports by Tonnage Handled 2010 United States, Mississippi River System (MRS), Great Lakes (GLNS), Mid-America Freight Coalition (MAFC) (Millions of Tons) |
|||||
| Port Name | Number of Top 150 Ports | Total Tonnage | Domestic Tonnage | Foreign Tonnage | |
| Imports | Exports | ||||
| Total Top 150 US Ports | 150 | 2,446.4 | 1,133.8 | 766.9 | 545.7 |
| MRS | 25 | 610.0 | 421.1 | 72.4 | 116.5 |
| GLNS | 34 | 207.5 | 169.8 | 14.8 | 22.8 |
| Subtotal MRS and GLNS | 60 | 817.5 | 590.9 | 87.2 | 139.4 |
| MRS Ports in MAFC States | 8 | 63.6 | 63.6 | 0 | 0 |
| GLNS Ports in MAFC States | 33 | 206.2 | 169.2 | 14.5 | 22.5 |
| Subtotal MAFC Ports | 41 | 269.8 | 232.8 | 14.5 | 22.5 |
Source: Tonnage for Selected US Ports
Table 5: Top MRS and MAFC River Ports 2010
| PORT NAME | Total Tonnage Handled (U.S. Tons) | US Port Rank 2010 | Domestic (U.S. Tons) | Foreign (U.S. Tons) |
| South Louisiana, LA, Port of | 236,262,069 | 1 | 121,110,982 | 115,151,087 |
| New Orleans, LA | 72,410,730 | 7 | 38,331,450 | 34,079,280 |
| Huntington-Tristate, WV | 61,521,942 | 9 | 61,521,942 | – |
| Plaquemines, LA, Port of | 55,836,687 | 11 | 36,927,933 | 18,908,754 |
| Baton Rouge, LA | 55,536,987 | 13 | 34,768,822 | 20,768,165 |
| Pittsburgh, PA* | 33,843,362 | 22 | 33,843,362 | – |
| St. Louis, MO and IL | 30,772,951 | 24 | 30,772,951 | – |
| Cincinnati, OH | 12,708,524 | 44 | 12,708,524 | – |
| Memphis, TN | 12,155,049 | 46 | 12,155,049 | – |
| Louisville, KY | 6,169,971 | 67 | 6,169,971 | – |
| Mount Vernon, IN | 5,629,444 | 70 | 5,629,444 | – |
| St. Paul, MN | 4,753,808 | 75 | 4,753,808 | – |
| Vicksburg, MS | 3,350,189 | 82 | 3,350,189 | – |
| Greenville, MS | 2,714,951 | 91 | 2,714,951 | – |
| Chattanooga, TN* | 2,012,662 | 105 | 2,012,662 | – |
| Nashville, TN* | 2,001,521 | 106 | 2,001,521 | – |
| Morgan City, LA, Port of | 1,986,244 | 108 | 1,979,417 | 6,827 |
| Guntersville, AL | 1,820,102 | 111 | 1,820,102 | – |
| Kansas City, MO | 1,671,245 | 114 | 1,671,245 | – |
| Rosedale, MS | 1,452,391 | 119 | 1,452,391 | – |
| Helena, AR | 1,385,190 | 121 | 1,385,190 | – |
| Lake Providence, LA | 1,348,703 | 124 | 1,348,703 | – |
| Elvis Stahr Harbor, KY | 1,048,522 | 134 | 1,048,522 | – |
| Southeast Missouri Port, MO | 890,290 | 140 | 890,290 | – |
| Madison Parish, LA, Port of | 734,557 | 147 | 734,557 | – |
| Total Tonnage Handled | 610,018,091 | 421,103,978 | 188,914,113 |
Ports in MAFC states in bold and shaded.
Source: Tonnage for Selected US Ports
Table 6: Top GLNS Ports 2010
| PORT NAME | Total Tonnage Handled (U.S. Tons) | US Port Rank 2010 | Domestic (U.S. Tons) | Foreign (U.S. Tons) |
| Duluth-Superior, MN and WI | 36,598,247 | 18 | 26,936,111 | 9,662,136 |
| Chicago, IL | 18,534,237 | 37 | 15,381,973 | 3,152,264 |
| Two Harbors, MN | 13,877,097 | 42 | 13,391,512 | 485,585 |
| Detroit, MI | 13,406,493 | 43 | 10,792,960 | 2,613,533 |
| Cleveland, OH | 10,791,326 | 48 | 9,218,274 | 1,573,052 |
| Toledo, OH | 10,720,187 | 49 | 3,927,139 | 6,793,048 |
| Indiana Harbor, IN | 10,168,960 | 50 | 9,901,838 | 267,122 |
| Presque Isle, MI | 8,720,506 | 55 | 6,447,080 | 2,273,426 |
| St. Clair, MI | 7,988,201 | 58 | 7,988,201 | – |
| Gary, IN | 7,831,215 | 59 | 7,607,812 | 223,403 |
| Ashtabula, OH | 6,346,279 | 65 | 3,811,252 | 2,535,027 |
| Silver Bay, MN | 6,190,949 | 66 | 6,139,123 | 51,826 |
| Burns Waterway Harbor, IN | 6,055,201 | 68 | 5,669,781 | 385,420 |
| Stoneport, MI | 5,648,756 | 69 | 5,138,231 | 510,525 |
| Calcite, MI | 4,760,464 | 74 | 4,198,791 | 561,673 |
| Escanaba, MI | 4,735,674 | 76 | 4,524,033 | 211,641 |
| Port Inland, MI | 4,694,580 | 77 | 4,373,191 | 321,389 |
| Conneaut, OH | 3,558,487 | 80 | 3,415,307 | 143,180 |
| Port Dolomite, MI | 3,248,590 | 84 | 2,703,076 | 545,514 |
| Marblehead, OH | 2,588,092 | 92 | 2,170,121 | 417,971 |
| Milwaukee, WI | 2,434,985 | 96 | 1,323,427 | 1,111,558 |
| Monroe, MI | 2,412,543 | 97 | 2,400,638 | 11,905 |
| Sandusky, OH | 2,304,141 | 99 | 990,486 | 1,313,655 |
| Alpena, MI | 2,148,171 | 101 | 1,928,496 | 219,675 |
| Green Bay, WI | 1,909,845 | 109 | 1,752,408 | 157,437 |
| Fairport Harbor, OH | 1,498,425 | 117 | 1,231,809 | 266,616 |
| Muskegon, MI | 1,478,753 | 118 | 1,324,547 | 154,206 |
| Buffalo, NY* | 1,298,279 | 126 | 610,884 | 687,395 |
| Buffington, IN | 1,128,061 | 129 | 865,507 | 262,554 |
| Drummond Island, MI | 1,069,169 | 131 | 795,246 | 273,923 |
| Marquette, MI | 1,009,550 | 136 | 793,297 | 216,253 |
| Lorain, OH | 852,982 | 144 | 645,126 | 207,856 |
| Grand Haven, MI | 762,998 | 146 | 695,953 | 67,045 |
| Huron, OH | 716,514 | 150 | 716,514 | – |
| Total Tonnage Handled | 207,487,957 | 169,810,144 | 37,677,813 |
All ports but Buffalo are in MAFC States.
Source: Tonnage for Selected US Ports
Figure 2: Top MRS Ports—Inbound and Outbound Tonnage 2010
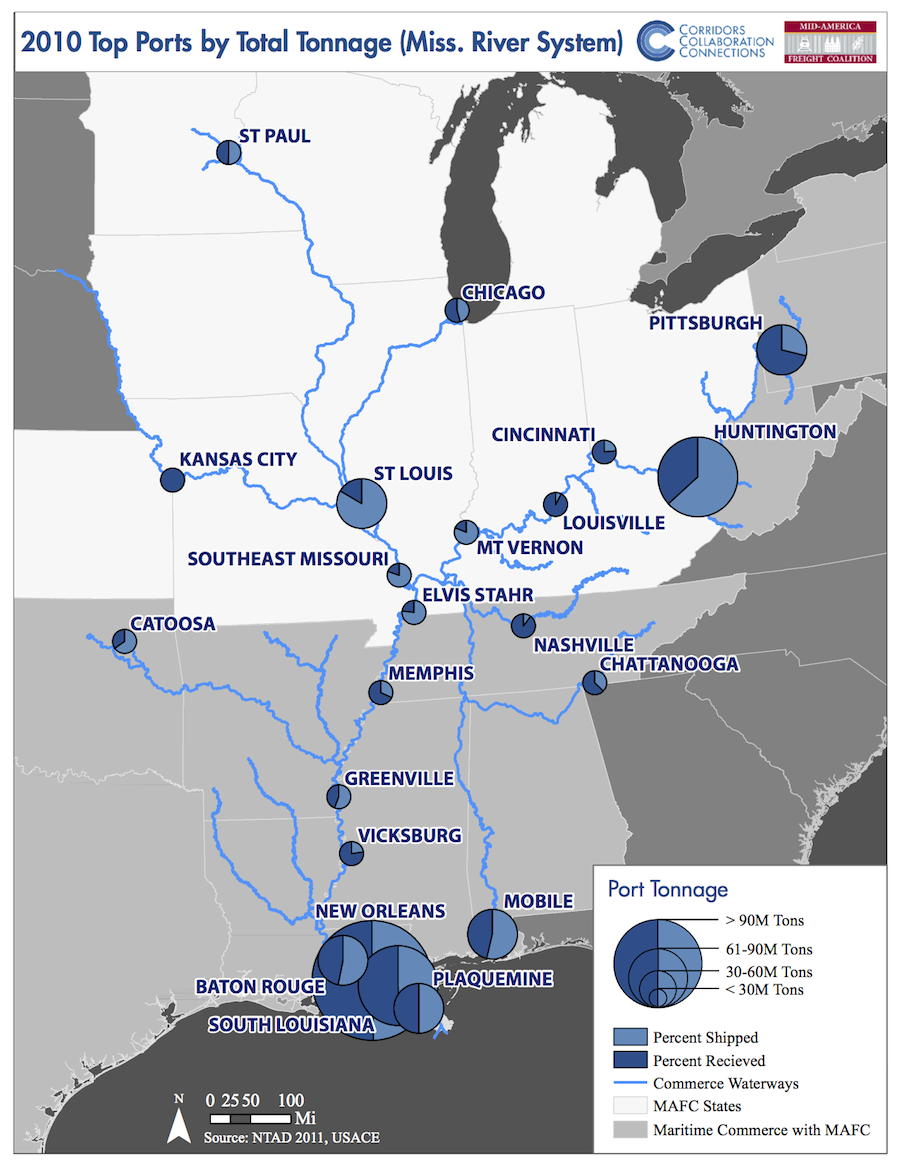
Figure 3: Top GLNS Ports—Inbound and Outbound Tonnage 2010
MAFC Maritime Freight Movement by Waterway
Table 7 illustrates the extent and total volume of freight movement between various segments of the MRS and between the MRS and the Great Lakes in 2010. Commodity flows between non-MAFC waterways were not included, but are relatively small. The shaded waterway segments indicate those river segments that are partly or completely bordered by MAFC states.
Figure 4 illustrates the relative volume of maritime freight movement by commodity on the major MRS river corridors in 2010. Figure 5 illustrates the flow of commodities between major ports on the Great lakes. Detailed commodity data within the individual Great Lakes and its ports is detailed in Appendices G and H.
In terms of total tonnage moved and handled, a large percentage inland maritime freight is internal to two of the larger MAFC waterways: the Ohio River and the Great Lakes. The Ohio River system is the single busiest waterway in the MRS with 148 million tons of commodities shipped between ports on the same river. Coal is the dominant commodity along with grain and soybean crops, and aggregates such as sand and gravel. The freight movement between the four upper Great Lakes of the GLNS is the second busiest system, moving large quantities of iron ore, coal, limestone, and other commodities.
The most significant pattern of freight movement between two or more waterways in the MRS is the shipment of 73 million tons of commodities (mostly agricultural) from three MAFC waterways (the Upper Mississippi, the Ohio River, and Illinois River) to the deep-water ports in the Lower Mississippi River between Baton Rouge and the Gulf of Mexico. The vast majority of this tonnage was corn, soybeans, and other crops destined for export. In 2003, Louisiana ports handled more than 60 percent of US grain exports and received about 90 percent of export grains by barge.
Table 7: MAFC Maritime Freight Flows by Waterway 2010
| Shipped To (Millions of Tons) | |||||||||||||
| Shipped from (Millions of Tons) | Great Lakes System (U.S.) | Mississippi River – MN to Illinois R. | Illinois Waterway | Mississippi River: Illinois R. to Ohio R. | Missouri River | Ohio River System | Mississippi River: Ohio R. to Baton Rouge | Arkansas River | Mississippi River: Baton Rouge to Gulf | Tennessee River | Mobile River System | Gulf Coast East | Gulf Coast West |
| Great Lakes System (U.S) | 83.24 | 0.13 | 0.64 | 0.06 | 0 | 0.36 | 0.07 | 0.02 | 0.71 | 0.07 | 0.02 | 0.22 | 0.07 |
| Mississippi River –MN to Illinois R. | 0.02 | 4.55 | 0.13 | 0.24 | 0.07 | 0.20 | 0.50 | 0.02 | 15.09 | 0.75 | 0.04 | 0.00 | 0.03 |
| Illinois Waterway | 1.29 | 0.04 | 5.70 | 0.24 | 0 | 0.73 | 0.53 | 0.08 | 14.64 | 0.29 | 0.10 | 0.02 | 0.54 |
| Mississippi River: Illinois R. to Ohio R. | 0.05 | 2.64 | 1.35 | 1.59 | 0.12 | 8.18 | 11.83 | 0.29 | 17.36 | 0.42 | 0.31 | 0.36 | 1.45 |
| Missouri River | 0 | 0.07 | 0 | 0.05 | 4.23 | 0 | 0 | 0.04 | 0.04 | 0.03 | 0 | 0 | 0 |
| Ohio River System | 0.16 | 0.38 | 0.31 | 1.92 | 0 | 148.83 | 2.66 | 0.21 | 25.95 | 2.03 | 1.36 | 0.98 | 2.34 |
| Mississippi River: Ohio R. to Baton Rouge | 0.03 | 0.10 | 0.12 | 0.13 | 0 | 0.55 | |||||||
| Arkansas River | 0.04 | 0.01 | 0.15 | 0.01 | 0 | 0.23 | |||||||
| Mississippi River: Baton Rouge to Gulf | 1.10 | 2.89 | 3.71 | 1.91 | 0.06 | 10.80 | |||||||
| Tennessee River | 0.08 | 0.20 | 0.11 | 0.06 | 0 | 4.84 | |||||||
| Mobile River System | 0.01 | 0.01 | 0.11 | 0.02 | 0 | 0.76 | |||||||
| Gulf Coast East | 0.00 | 0.12 | 0.11 | 0.07 | 0.00 | 0.90 | |||||||
| Gulf Coast West | 0.37 | 1.31 | 1.58 | 0.78 | 0.00 | 5.01 | |||||||
Note: MAFC waterways shaded in gray.
Sources: Region to Region Public Domain Data Base by Origin-2010 and Region to Region Public Domain Data Base by Destination-2010
Figure 4: Volume of Maritime Freight by Commodity MRS 2010

Figure 5: Commodity Flows between Major GLNS Ports
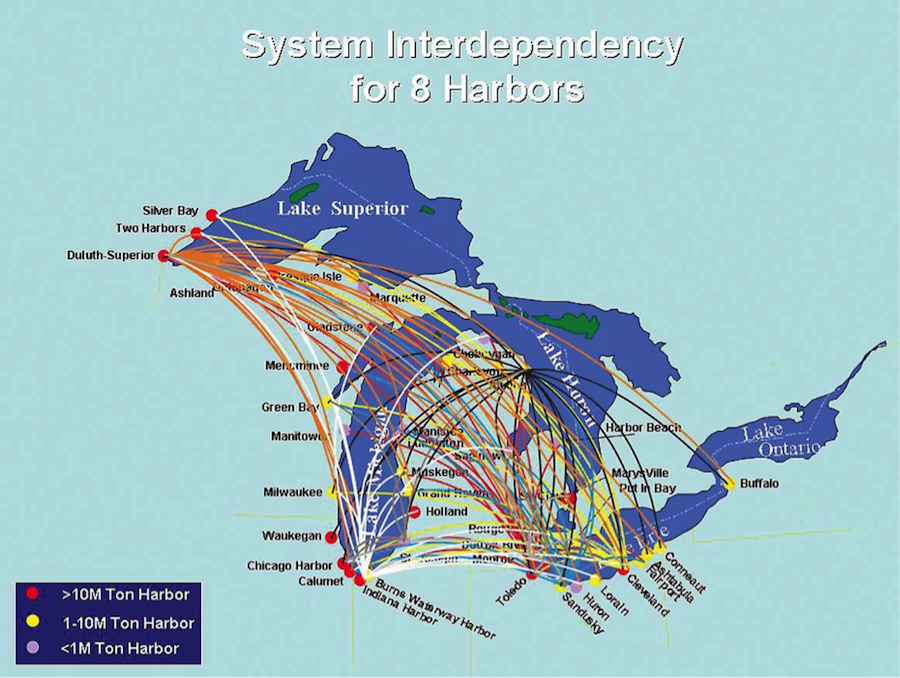
Source: Great Lakes Navigation System