There are a number of trends impacting the air cargo market. The market overall is expanding primarily where port, rail, and road infrastructure is poor, and air cargo is often the sole contributor. In developed countries where energy costs are high coupled with more alternative transportation options (such as rail and port), air cargo is declining. A.T. Kearney (2009) has developed a trend chart from 1991 to 2007 (pre-recession), highlighting a 2.3 multiple of the air cargo market to GDP growth during that period. This means that the market grows, on average, 2.3 times the GDP number, although there is no evidential correlation for years in which GDP contracts. Boeing (2012-2013) outlined world cargo traffic will more than double through 2031 at a compounded annual growth rate (CAGR) of 5.2 percent, after only expanding an average of 3.7 percent from 2001-2012, and about 6.5 percent CAGR each year from 1981-2001. Intra-North America growth rates are expected to be below average at 2.3 percent annual growth through 2031. Domestic cargo revenue-ton-miles (RTMs) are forecast to decline by .9 percent in 2013 (Federal Aviation Administration, FY 2013-2033). Between 2013 and 2033, domestic cargo RTMs are forecast to increase at an average annual rate of .8 percent.
The regions forecasted for the highest growth opportunity through 2031 are dominated by developing markets, with domestic China and Intra-Asia forecast at 8.0 percent and 6.9 percent annual growth, respectively. The international express share of world air cargo expanded 4.1 percent to 12.8 percent from 1992 to 2008. Average shipment size went from 2.7kg to 6.2kg between 1992 and 2011. Non-scheduled US freight had nearly 71 percent market share in the air cargo category; scheduled US freight had nearly 19 percent in 2011.
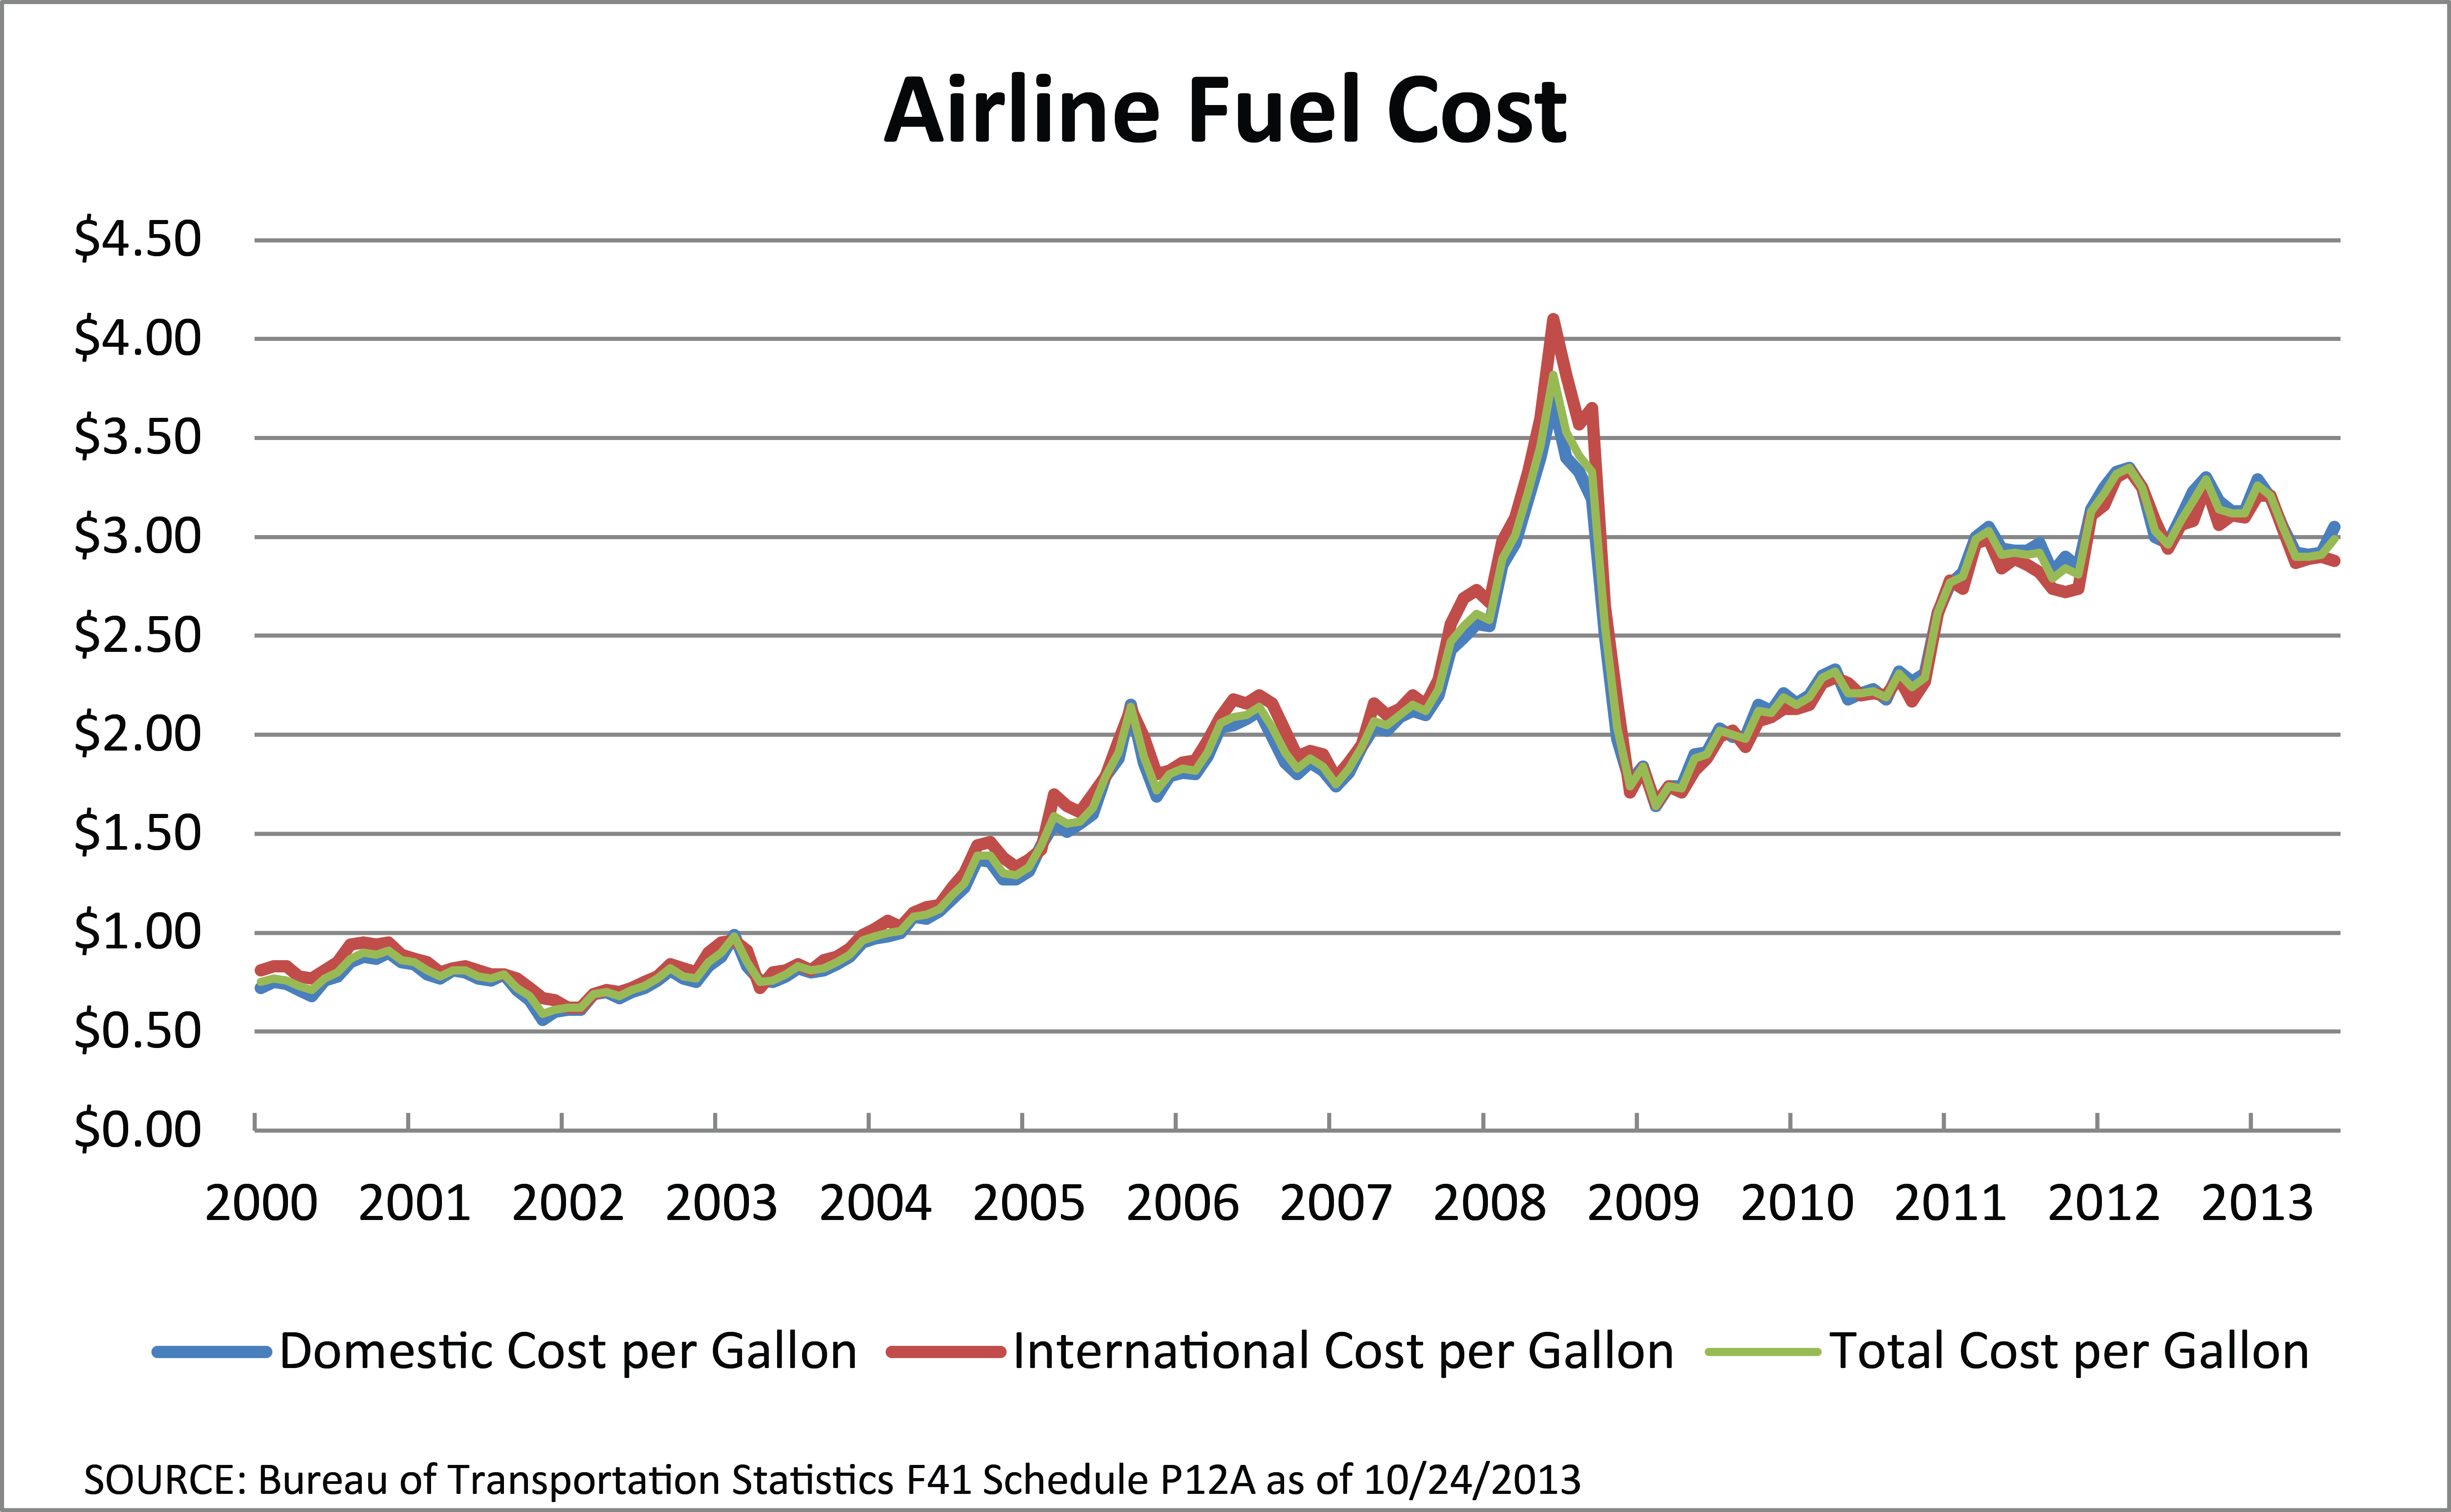
The price of jet fuel has tripled over the past 8 years and is likely to stay volatile in the near term, and slightly decline over the next 5 years as new energy discoveries emerge. After the price of oil increased by 6.9 percent in 2012 and 88 percent in total since 2009, IHS Global Insight (Federal Aviation Administration, FY 2013-2033) projects the price, as measured by the Refiners’ Acquisition Cost, to reach $91 per barrel in 2013 (down 11.5 percent from 2012). Oil prices are forecast to decline to $81/barrel by 2015 and then gradually increase to $112/barrel by 2025. For the remainder of the forecast period, oil prices are projected to grow slower than inflation, reaching $125/barrel by 2033. Since the turn of the century, domestic jet fuel prices reached a low in December 2001 at 56 cents per gallon and a high in July of 2008 at $3.69. Internationally, the low was reached in February of 2002 at 62 cents per gallon and a high of $4.10 also in July of 2008.
Figure 1: Airline Fuel Cost
It’s important to note that in 2013 the FAA has changed its model for the US domestic market from a GDP based model to a model based on real disposable personal income (DPI). The FAA believes that aviation demand is derived demand. In other words, aviation demand depends upon the level of business and leisure activity in the economy. The level of business and especially leisure activity in the economy is driven in large part by the amount of disposable income (income after taxes) in the economy. As the US economy recovers from the great recession, GDP growth may come from areas that don’t necessarily translate directly into income growth (inventory accumulation or a reduction in imports). This also allows for any changes in future tax policy that impact individual taxes, which are directly reflected in changes to DPI as opposed to GDP.
Outside of these trends, another major shift in the air cargo market is taking place: the immergence of e-commerce. UPS has seen great benefits from the incorporation of e-commerce practices in their air cargo division, that it even warranted a mention in the company’s Q1 2013 earnings call (UPS, 2013:
UPS results continue to be lifted by e-commerce, as omnichannel strategies are playing a bigger role…and increased focus by traditional retailers on using their brick-and-mortar locations as distribution sites is creating more pickups at retail locations for ultimate residential delivery.
In addition, they mentioned that roughly 25 major US retailers have signed up to use the carrier’s omnichannel services. According to UPS those services include UPS CampusShip, which allows retailers to ship products from either a warehouse or store depending on which is closest to a customer; UPS Trade Direct, which consolidates international freight, provides customs clearance and includes delivery to multiple addresses within a destination country; and an array of smaller services, such as helping e-commerce sites offer multiple shipping options and delivery locations, processing returns and allowing customers to track their packages.
On a broader industry scale, IATA published notes showing the Global Air Cargo Advisory Group (CACAG), displaying multiple benefits of incorporating e-commerce (IATA, 2012). It is based on developing e-freight on a worldwide scale using “one vision, several pillars.”
The first pillar asks for the creation of e-freight route network; in essence a network of countries where e-freight procedures are possible for a core set of documents. The second pillar calls for the digitalization of core transport documents (that are air industry driven); such documents include e-airway bills, e-house manifests, and e-consignment security declarations. The third pillar calls for the digitization of accompanying documents.
The E-Commerce Task Force has fully endorsed the approach to expanding the e-freight network to cover 80 percent of the global air cargo network by the end of 2015. Its role will be to support the lobbying efforts to achieve this, including the BRIC countries. One of the challenges is to ensure that there is full traction of e-freight across this network and that it is not only focused on the airport-to-airport sector.
The same report includes a case study conducted by the Cathay Pacific Export Office (IATA, 2012). This study analyzed the various steps involved in a typical transaction, focusing on the export, import, accounting, and archive processes. They used this to identify time savings per activity, and later aggregate overall benefits of these time savings, as well as identify the additional non-qualitative benefits e-freight provided. As a result, manual activities were drastically simplified. These improvements can be shown in the below graphic:
Figure 2: Quantified Improvements in E-Freight (IATA, 2012)

E-commerce is also changing the landscape of air cargo in regards to infrastructure as well. Colliers estimates that in 3-5 years, there will be only about 6-8 dominant US air cargo markets, including, Memphis, Louisville, Columbus (OH), Miami, New York, Los Angeles, Seattle, and Denver (Conway, April 2013). Increasing e-commerce activity drives out the need for many physical infrastructure systems to be in use, thus consolidating the locations to the prime markets listed above. A key factor in the determinant of the future strength of an air cargo location will be how close its ties are with area ports. Port partnerships will be critical to the future success of such facilities.