Air-freight infrastructure is vital for moving high-value goods. Air freight is used to transport time-sensitive (perishables, express parcels, etc.) and value-sensitive goods (just-in-time inputs, pharmaceuticals, etc.). Air freight is limited to time and value sensitive shipments because of cost. Air cannot compete on a strictly cost per ton basis when compared to truck, water, or rail. Figure 1 displays the locations, classifications, and freight activity of MAFC airports. The colored markers show freight activity at the airport and are separated by type. Commercial airports are publicly owned and defined as having more than 2,500 scheduled passengers per year. Reliever airports are designated by FAA as airports that relieve congestion at commercial airports. General Aviation airports are those sites that do not meet the classification of commercial or reliever. The MAFC has a total of 817 airports, the majority of which are classified as general aviation. Additionally, the MAFC has several critical air freight hubs including the UPS Worldport in Louisville, FedEx’s second largest airport hub in Indianapolis, and Chicago’s O’Hare International.
Figure 1: Air Freight Infrastructure in the MAFC
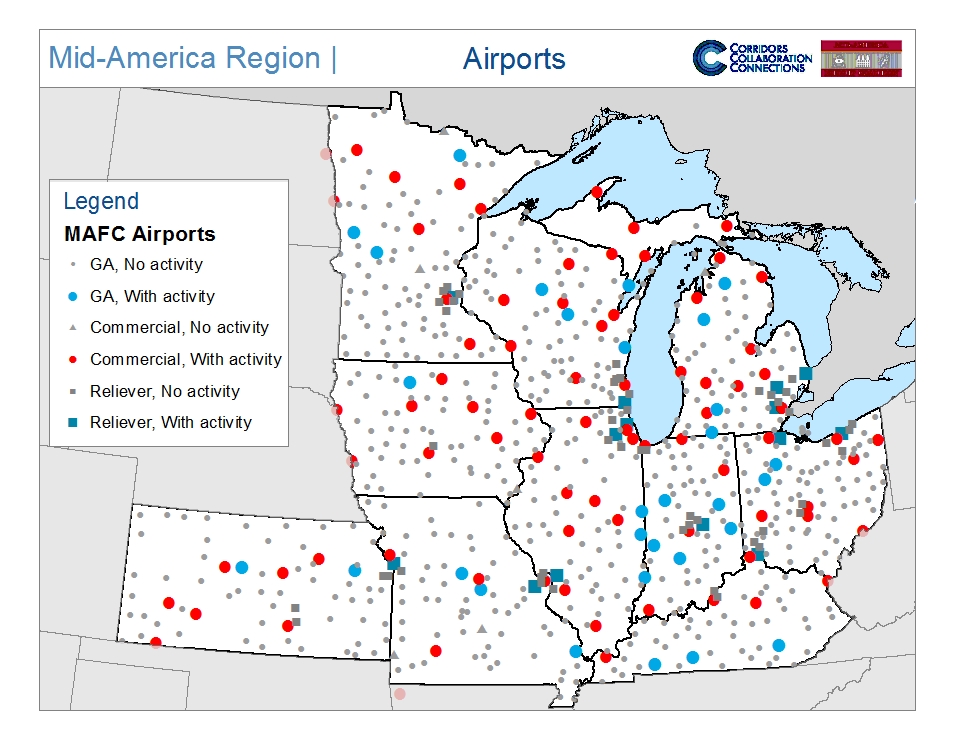
Source: Esri Business Analyst, 2011
Beyond counting airports in the MAFC, Table 1 displays the total tonnage of emplaned and landed mail and freight in the MAFC. Enplaned can be thought of as originating in the MAFC and landed is freight destined for the MAFC. As such, in 2010 the MAFC was responsible for 7 million tons or 23.1 percent of total air freight activity in the US.[1]
Table 1: 2010 Air Freight in the MAFC
| State | Enplaned (Tons) | Landed (Tons) | Total Activity (Tons) | MAFC Share |
| Illinois | 791,565 | 957,976 | 1,749,541 | 25.0% |
| Indiana | 546,405 | 509,747 | 1,056,153 | 15.1% |
| Iowa | 58,401 | 52,341 | 110,742 | 1.6% |
| Kansas | 11,700 | 17,311 | 29,011 | 0.4% |
| Kentucky | 1,432,657 | 1,370,455 | 2,803,112 | 40.0% |
| Michigan | 123,702 | 161,248 | 284,950 | 4.1% |
| Minnesota | 124,860 | 131,251 | 256,111 | 3.7% |
| Missouri | 100,436 | 102,037 | 202,473 | 2.9% |
| Ohio | 203,091 | 191,379 | 394,470 | 5.6% |
| Wisconsin | 57,300 | 58,533 | 115,834 | 1.7% |
| Total MAFC | 3,450,118 | 3,552,279 | 7,002,396 | 100.0% |
Source: Air Cargo in the Mid-America Freight Coalition Region, 2012
As with the other modes of transportation, air freight contributes to employment in the MAFC. In this case, a map is largely unnecessary because employment is generally at the airport in the form of airport operations and air traffic control. Air freight is similar to maritime transportation in that it is a relatively small employer and supports very few businesses in the MAFC.
Table 2: Air Freight Employment and Businesses in the MAFC
| State | Air Freight Employment | Air Freight Businesses | Total State Employment | Total Business Count |
| Iowa | 186 | 28 | 5,884,453 | 476,575 |
| Illinois | 1,082 | 122 | 2,938,335 | 222,320 |
| Indiana | 539 | 39 | 1,607,190 | 136,378 |
| Kansas | 40 | 8 | 1,407,272 | 123,790 |
| Kentucky | 638 | 25 | 1,819,898 | 153,924 |
| Michigan | 272 | 81 | 4,305,125 | 371,368 |
| Minnesota | 289 | 73 | 2,888,004 | 221,993 |
| Missouri | 430 | 44 | 2,883,801 | 239,690 |
| Ohio | 364 | 75 | 5,634,785 | 413,878 |
| Wisconsin | 227 | 54 | 3,063,309 | 244,656 |
| MAFC | 4,067 | 549 | 32,432,172 | 2,604,572 |
Source: Esri Business Analyst, 2011
[1] The MAFC total for Table 1 double counts trade within the MAFC when thinking about total tonnage traveling by air.