The analysis of the MAFC region is heavily reliant on the Freight Analysis Framework (FAF) released by the Federal Highway Administration (FHWA). FAF is based on a 2007 sampling of freight carriers of all modes throughout the United States. FAF also uses the 2007 sampling to forecast future freight demand. Keeping in mind the collection date of FAF data, the majority of the data presented here will be reported from 2007 to show flows as collected in 2007. FAF was chosen for a number of reasons; among those is its availability, its use by US DOT, and many MAFC state freight plans use FAF data.
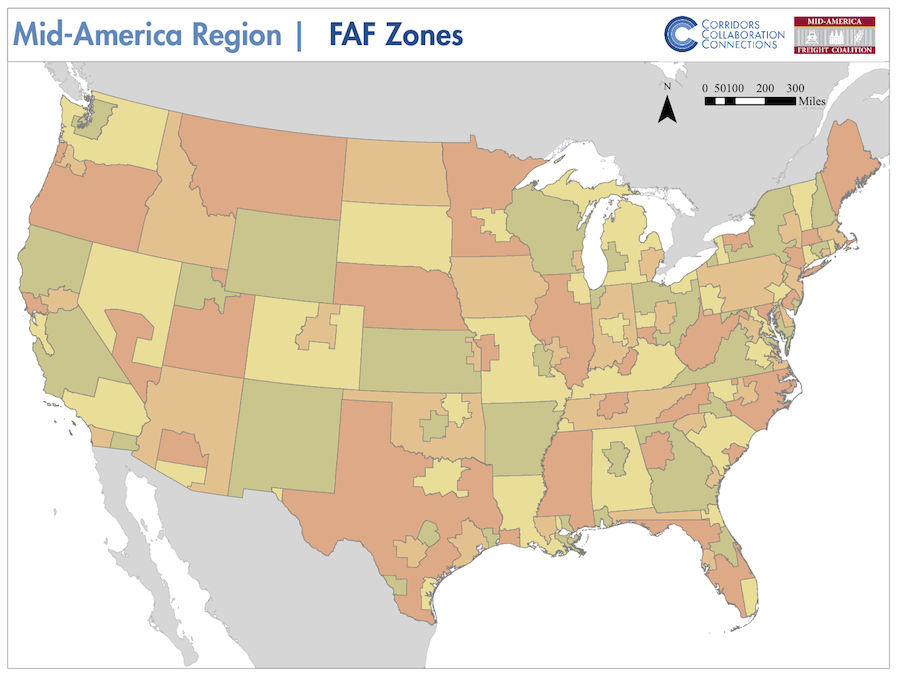
FAF displays freight flows throughout the United States with origin and destination pairs. The US is split into 143 FAF zones that encompass various geographic extents. Figure 1 displays the distribution of FAF zones throughout the US. Notice that some states are one FAF zone whereas others are split into as many as 8 FAF zones. FAF organizes a freight flow with one origin and one destination. Therefore, the analysis below displays the movement of commodities whose origin and/or destination is a MAFC FAF zone. From a MAFC perspective FAF has three types of freight flows, those that originate outside the MAFC and are destined within the MAFC, those that originate in the MAFC and are destined outside the MAFC, and finally flows that both originate and are destined for the MAFC. While there are freight flows that move through the MAFC, FAF does not provide data on these flows and FHWA does not have a methodology to identify the quantity of freight traffic that transits through a state or FAF zone.
Figure 1: US Map of FAF 3 Zones
The analytical technique used in this section is to split out the importance of different modes and commodities at different geographic extents. The smallest extent possible using the FAF dataset is individual FAF zones in the MAFC. CFIRE has collected and displayed data at the FAF zone level, but displaying tables for all 26 MAFC FAF zones would unnecessarily divert the focus from the region. Therefore, this section will focus on the MAFC as a whole and include state data in the appendix to this section. The process of collecting MAFC data on top trading partners, modal distribution, and commodity flows begins with an examination of each state aggregated up from the composite state FAF zones. Data that presents modal distribution, commodity flows, and top trading partners for individual FAF zones are available for MAFC states upon request.
After aggregating up from the FAF zone level to each MAFC state, states are aggregated up to the MAFC region. The goal of this data presentation method is to display the freight flows in the MAFC region in terms of top trading partners, modal distribution, and commodity flow. Lastly, each geographic extent will be analyzed based on both a tonnage and value basis. Differences in the value and weight of commodities will be shown to contrast differences in modal distribution of commodities.
Table 1 displays the FAF zones for the MAFC. In total the MAFC has 26 FAF zones, ranging from one to five zones per state. Notice how cities such as Chicago and Kansas City are split into zones in two states, therefore it is important to note not only the city but the state where freight activity is taking place. States with more than one FAF zone will have a remainder of the state FAF zone which represents the areas of the state not already accounted for by other in state FAF zones. For instance, Wisconsin is split into Milwaukee and the remainder of that state. Every portion of the state not represented in the Milwaukee FAF zone is in the remainder of Wisconsin FAF zone.
Table 1: MAFC FAF 3 Zones Organized by State
| State of FAF Region | FAF Regions* | Code |
| Illinois | Chicago | 171 |
| St. Louis | 172 | |
| Illinois, Remainder of State | 179 | |
| Indiana | Chicago | 181 |
| Indianapolis | 182 | |
| Indiana, Remainder of State | 189 | |
| Iowa | Iowa | 190 |
| Kansas | Kansas City | 201 |
| Kansas, Remainder of State | 209 | |
| Kentucky | Louisville | 211 |
| Kentucky, Remainder of State | 219 | |
| Michigan | Detroit | 261 |
| Grand Rapids | 262 | |
| Michigan, Remainder of State | 269 | |
| Minnesota | Minneapolis | 271 |
| Minnesota, Remainder of State | 279 | |
| Missouri | Kansas City | 291 |
| St. Louis | 292 | |
| Missouri, Remainder of State | 299 | |
| Ohio | Cincinnati | 391 |
| Cleveland | 392 | |
| Columbus | 393 | |
| Dayton | 394 | |
| Ohio, Remainder of State | 399 | |
| Wisconsin | Milwaukee | 551 |
| Wisconsin, Remainder of State | 559 |
Source: FAF 3 Regions Boundary Layer, n.d.
Another note about FAF is the proclivity to double count freight flows when aggregating from the FAF zone to the state level and again from the state to the regional level. Double counting results from adding individual FAF zone origin and destination pairs which double counts all intra-zone trade. If total tonnage is the sum of all freight that originates in the state and all freight that is destined for the state, intrastate movements are counted twice. The same issue arises when aggregating to the MAFC level, but instead of intra-state trade being double counted intra-MAFC flows are double counted. Therefore, in many cases, tables will not be totaled unless within trade is analyzed because the total is not a true reporting of total freight flows. Similarly, total MAFC trade will not be equal to the summation of MAFC states.
MAFC Origin and Destination
FAF 3.4 is used for the origin and destination analysis of the MAFC and separate tables are available in the appendix of this section. The appendix includes tables of the top 10 trading partners for each of the MAFC states. The framing of the MAFC origin and destination section of the RFS is around the region’s imports and exports by tonnage and value. The framing of this analysis focuses on the MAFC as a region and assesses what moves into, out of, and within the region. Therefore, subsequent tables will only include trading partners that are outside of the MAFC. All freight that originates in the MAFC and is destined for non-MAFC states viewed as an export for the region. Conversely, all freight that originates in a non-MAFC state and is destined for the MAFC is an import for the region. Lastly, movements within the MAFC can be thought of regional self-reliance.
The importance of intra-MAFC trade cannot be understated; because the MAFC’s largest trading partner on an origin and destination basis is itself. Of the 5.8 billion tons of freight with a MAFC origin or destination, 3.92 billion tons or 67.5 percent, was shipped within the MAFC. To put this number into perspective, the top ten non-MAFC state trading partners trade a total of 1.23 billion tons or 21.1 percent of total MAFC freight movements for 2007. The ten MAFC states trade over three times as much with each other as the top ten non-MAFC states. On a value basis, the MAFC trades 52.8 percent of total value of freight shipped with itself.
MAFC Origin
We will begin our analysis of MAFC trade flows with freight that originates in the MAFC and is destined outside of the MAFC. This section can be thought of as exports for the MAFC. Table 2 begins the discussion of where freight that originates in the MAFC is destined. Table 2 lists the top fifteen FAF zones by tonnage where freight is destined.
Table 2: Top Non-MAFC Destinations of Freight Originating in the MAFC by Tonnage (exports)
| Rank | Destination | State | Tonnage (‘000 of tons) |
| 1 | New Orleans | LA | 84,931 |
| 2 | Louisiana | LA | 45,467 |
| 3 | Georgia, Remainder of State | GA | 35,224 |
| 4 | Tennessee, Remainder of State | TN | 33,266 |
| 5 | Houston | TX | 30,547 |
| 6 | West Virginia | WV | 27,923 |
| 7 | Los Angeles | CA | 26,035 |
| 8 | Pennsylvania, Remainder of State | PA | 25,278 |
| 9 | Nebraska | NE | 22,090 |
| 10 | Texas, Remainder of State | TX | 21,588 |
| 11 | Atlanta | GA | 21,443 |
| 12 | Dallas | TX | 20,437 |
| 13 | Seattle | WA | 20,257 |
| 14 | Arkansas | AR | 19,789 |
| 15 | Alabama, Remainder of State | AL | 18,335 |
Source: Freight Analysis Framework 3.4, 2013
Table 3 displays the destinations of freight originating in the MAFC similar to Table 2, but uses value instead of tonnage to find the top 15 FAF zones. In total, between Tables 2 and 3 there are a total of 20 unique FAF zones that the MAFC trades heavily with. Generally, the switch from tonnage to value favors Eastern FAF zones and replaces Southern FAF zones. For example, New Orleans, the remainder of Louisiana, Georgia, West Virginia, and Alabama which were top 15 for tonnage where replaced with New York in New Jersey, New York in New York, San Francisco, Buffalo, and Pittsburg. Even more interesting is that New Orleans, Louisiana, Georgia where the top three destinations based on tonnage and don’t make the top 15 in value.
Table 3: Top Non-MAFC Destinations of Freight Originating in the MAFC by Value (exports)
| Rank | Destination | State | Origin ($millions) |
| 1 | Los Angeles | CA | $83,723 |
| 2 | Pennsylvania, Remainder of State | PA | $47,453 |
| 3 | New York | NJ | $45,005 |
| 4 | Dallas | TX | $43,895 |
| 5 | Atlanta | GA | $43,027 |
| 6 | Houston | TX | $37,688 |
| 7 | Texas, Remainder of State | TX | $33,885 |
| 8 | Tennessee, Remainder of State | TN | $29,484 |
| 9 | San Francisco | CA | $27,579 |
| 10 | New York | NY | $26,493 |
| 11 | Nebraska | NE | $25,039 |
| 12 | Arkansas | AR | $23,633 |
| 13 | Buffalo | NY | $23,571 |
| 14 | Seattle | WA | $21,705 |
| 15 | Pittsburgh | PA | $20,994 |
Source: Freight Analysis Framework 3.4, 2013
The changes in top 15 destinations for MAFC freight is largely explained by differences in commodities shipped to the listed FAF zones. For instance, freight shipped to Los Angeles is valued at $3,216 per ton whereas freight destined for New Orleans is valued at $232 per ton. Intuitively, freight destined for New Orleans is likely low-value waterborne bulk commodities. Conversely, goods destined for Los Angeles are likely being exported via the Port of Long Beach and are valued much higher than those destined for New Orleans.
Table 4: Value per Ton of Top Destinations for MAFC Freight
| Rank | FAF Zone | State | Value ($‘000) | Tons (‘000) | $/ton |
| 1 | New York | NY | $26,493,207 | 5,431 | $4,878 |
| 2 | San Francisco | CA | $27,578,501 | 5,851 | $4,713 |
| 3 | New York | NJ | $45,004,914 | 12,542 | $3,588 |
| 4 | Los Angeles | CA | $83,723,280 | 26,035 | $3,216 |
| 5 | Buffalo | NY | $23,570,617 | 10,931 | $2,156 |
| 6 | Dallas | TX | $43,895,494 | 20,437 | $2,148 |
| 7 | Atlanta | GA | $43,026,758 | 21,443 | $2,007 |
| 8 | Pennsylvania, Remainder of State | PA | $47,452,938 | 25,278 | $1,877 |
| 9 | Texas, Remainder of State | TX | $33,884,790 | 21,588 | $1,570 |
| 10 | Pittsburgh | PA | $20,993,800 | 14,370 | $1,461 |
| 11 | Houston | TX | $37,687,591 | 30,547 | $1,234 |
| 12 | Arkansas | AR | $23,632,945 | 19,789 | $1,194 |
| 13 | Nebraska | NE | $25,039,153 | 22,090 | $1,134 |
| 14 | Seattle | WA | $21,705,002 | 20,257 | $1,071 |
| 15 | Alabama, Remainder of State | AL | $16,961,473 | 18,335 | $925 |
| 16 | Tennessee, Remainder of State | TN | $29,483,688 | 33,266 | $886 |
| 17 | West Virginia | WV | $20,548,692 | 27,923 | $736 |
| 18 | Georgia, Remainder of State | GA | $20,424,140 | 35,224 | $580 |
| 19 | Louisiana | LA | $13,585,760 | 45,467 | $299 |
| 20 | New Orleans | LA | $19,665,012 | 84,931 | $232 |
Source: Freight Analysis Framework 3.4, 2013
MAFC-Destined
The MAFC-destined section outlines the movement of freight into the MAFC from non-MAFC states. This section is the import side of MAFC freight movements, in that the freight originates outside the MAFC and is destined for the MAFC. Table 5 displays the top non-MAFC origins for freight destined for the MAFC by tonnage.
Table 5: Top Non-MAFC Origin of Freight Destined for the MAFC by Tonnage (imports)
| Rank | Origin | State | Tonnage(‘000) |
| 1 | Wyoming | WY | 269,282 |
| 2 | Houston | TX | 56,702 |
| 3 | Nashville | TN | 48,373 |
| 4 | West Virginia | WV | 40,812 |
| 5 | Montana | MT | 35,364 |
| 6 | North Dakota | ND | 33,174 |
| 7 | Louisiana | LA | 31,350 |
| 8 | Texas, Remainder of State | TX | 30,902 |
| 9 | Los Angeles | CA | 20,937 |
| 10 | Nebraska | NE | 20,728 |
| 11 | Colorado, Remainder of State | CO | 19,978 |
| 12 | Dallas | TX | 18,875 |
| 13 | Arkansas | AR | 14,936 |
| 14 | New Orleans | LA | 14,723 |
| 15 | Pittsburgh | PA | 14,698 |
Source: Freight Analysis Framework 3.4, 2013
Table 6 displays the top origins of freight destined for the MAFC by value instead of tonnage. Analyzing top origins of MAFC freight from a value perspective returns almost an entirely new top 15 origins. Compared to destinations which had 15 unique FAF zones destinations for MAFC freight, the origins of freight destined for the MAFC has 24 unique values.
Table 6: Top Non-MAFC Origin of Freight Destined for the MAFC by Value (imports)
| Rank | Origin | State | Value ($millions) |
| 1 | Los Angeles | CA | $111,814 |
| 2 | New York | NJ | $55,575 |
| 3 | Houston | TX | $41,722 |
| 4 | Memphis | TN | $39,849 |
| 5 | Seattle | WA | $37,314 |
| 6 | Texas, Remainder of State | TX | $35,224 |
| 7 | Tennessee, Remainder of State | TN | $34,015 |
| 8 | Dallas | TX | $33,973 |
| 9 | New York | NY | $33,250 |
| 10 | Pennsylvania, Remainder of State | PA | $32,688 |
| 11 | Alaska | AK | $27,084 |
| 12 | San Francisco | CA | $26,989 |
| 13 | Pittsburgh | PA | $26,272 |
| 14 | Laredo | TX | $26,198 |
| 15 | Nebraska | NE | $24,313 |
Source: Freight Analysis Framework 3.4, 2013
The MAFC has 24 unique FAF zones that are top origins of MAFC destined freight based on either value or tonnage. The difference between value per ton of the top five and the bottom five really displays the difference in the types of goods. The RFS seeks to parse out the FAF data set in multiple ways to display the nuances of freight movements for the MAFC region.
When comparing the value per ton of the MAFC’s freight exports to imports the MAFC imports lower value goods and exports higher value goods. The average value per ton of an exported good is $1,427 compared to $1,212 for an imported good. The modal distribution and top commodities of MAFC freight movements will be discussed further in the RFS, but this initial look provides a context for the rest of the analysis.
Top Trading Partner
Table 7 displays the top trading partners for the MAFC. Top trading partners is based on addition of tonnage both originating in and destined for the FAF zone. Table 7 is only non-MAFC FAF zones to show the most important trading partners outside the region. Generally, the top partners are either located West or South of the MAFC. Top trading partners provide an important context to remember when freight corridors are identified in subsequent sections of the RFS.
Table 7: Top Non-MAFC Trading Partners for the MAFC by Tonnage
| Rank | FAF Zone | State | Tonnage (‘000) |
| 1 | Wyoming | WY | 271,534 |
| 2 | New Orleans | LA | 99,654 |
| 3 | Houston | TX | 87,249 |
| 4 | Louisiana | LA | 76,816 |
| 5 | West Virginia | WV | 68,735 |
| 6 | Nashville | TN | 61,094 |
| 7 | Texas, Remainder of State | TX | 52,490 |
| 8 | Los Angeles | CA | 46,971 |
| 9 | Tennessee, Remainder of State | TN | 46,843 |
| 10 | North Dakota | ND | 46,683 |
| 11 | Georgia, Remainder of State | GA | 43,038 |
| 12 | Nebraska | NE | 42,818 |
| 13 | Pennsylvania, Remainder of State | PA | 39,950 |
| 14 | Dallas | TX | 39,312 |
| 15 | Montana | MT | 37,112 |
Source: Freight Analysis Framework 3.4, 2013
Table 8 displays the top non-MAFC FAF zones ranked by value. The geographic and modal distribution is much different than the list ranked by tonnage. The top 15 non-MAFC trading partners are more evenly distributed geographically than the list by tonnage.
Table 8: Top Non-MAFC Trading Partners for the MAFC by Value
| Rank | FAF Zone | State | Total ($millions) |
| 1 | Los Angeles | CA | $195,537 |
| 2 | New York | NJ | $100,580 |
| 3 | Pennsylvania, Remainder of State | PA | $80,141 |
| 4 | Houston | TX | $79,410 |
| 5 | Dallas | TX | $77,868 |
| 6 | Texas, Remainder of State | TX | $69,109 |
| 7 | Atlanta | GA | $66,242 |
| 8 | Tennessee, Remainder of State | TN | $63,499 |
| 9 | New York | NY | $59,743 |
| 10 | Seattle | WA | $59,019 |
| 11 | San Francisco | CA | $54,568 |
| 12 | Memphis | TN | $53,522 |
| 13 | Nebraska | NE | $49,352 |
| 14 | Pittsburgh | PA | $47,266 |
| 15 | Laredo | TX | $46,531 |
Source: Freight Analysis Framework 3.4, 2013
A noticeable attribute of the top trading partners for the MAFC by both value and tonnage is that a large portion of the top partners are whole states or the remainder of states. As a result, the top trading partners cover a large geographic area.
Considering there is a high cost to supply freight access to larger areas, we control for the area of FAF zone and recreate the top trading partner tables. Tables 10 and 11 display the top trading partners by tonnage an value per square mile. Essentially, from a MAFC perspective the land in the listed FAF zones is the most productive land in terms of trade and the supporting infrastructure is that much more important.
Table 9: Top Non-MAFC Trading Partners for the MAFC by Value per Square Mile
| Rank | FAF Zone | State | Total Trade per Square Mile ($millions) |
| 1 | Memphis | TN | $27.2 |
| 2 | New York | NJ | $24.2 |
| 3 | El Paso | TX | $20.1 |
| 4 | Washington | DC | $18.5 |
| 5 | Buffalo | NY | $14.4 |
| 6 | Laredo | TX | $13.8 |
| 7 | Philadelphia | PA | $12.7 |
| 8 | Baltimore | MD | $11.9 |
| 9 | New York | NY | $11.4 |
| 10 | Norfolk | VA | $10.3 |
Source: Freight Analysis Framework 3.4, 2013
Table 10: Top Non-MAFC Trading Partners for the MAFC by Tonnage per Square Mile
| Rank | FAF Zone | State | Total Trade per Square Mile (’000 of tons) |
| 1 | New Orleans | LA | 23.3 |
| 2 | Nashville | TN | 9.6 |
| 3 | Houston | TX | 7.8 |
| 4 | Memphis | TN | 7.6 |
| 5 | El Paso | TX | 7.4 |
| 6 | Buffalo | NY | 6.6 |
| 7 | New York | NJ | 5.6 |
| 8 | Tampa | FL | 5.5 |
| 9 | Beaumont | TX | 5.1 |
| 10 | Pittsburgh | PA | 5.1 |
Source: Freight Analysis Framework 3.4, 2013
MAFC Modal Distribution
In addition to the top trading partners, the MAFC supports a multi-modal transportation system that establishes an environment in the region for economic competitiveness. As reported in the overview of the freight system section, the MAFC has tremendous access to maritime transportation for the transport of bulk goods. Similarly, the integration of rail, road, water, and air transportation in key areas such as Chicago allows the region to utilize multiple modes to leverage the competitive advantages of each mode.
Table 11 displays the modal distribution of MAFC freight. Each column speaks to a different freight flow to show differences in freight originating, destined or traveling within the MAFC. The modal distribution column displays the difference in modal choice between goods imported into the region, exported out of the region, and those that travel within the region. Note the similarities between the modal distribution of imports and export. The MAFC clearly utilizes truck and rail transport heavily, as well as water and multi-modal freight transportation. Conversely, note how heavily the MAFC relies on trucking to move goods within the region. 83.4 percent of goods that originate within one MAFC state and are destined for another MAFC state travel by truck. The MAFCs heavy reliance on trucking for intra-MAFC freight movement is likely due to trucks competitive advantage on shorter hauls. The final column of Table 11 displays the MAFCs total modal distribution for all freight by tonnage. Generally, the heavy reliance on trucking for intra-MAFC trade pushes the modal distribution toward trucking. Conversely, the total reliance on rail is heavily influenced by shipments originating or destined outside of the MAFC relying heavily on rail transport.
Table 11: MAFC Modal Distribution by MAFC Imports, Exports, and Internal Movements by Tonnage
| MAFC | Non-MAFC Origin (‘000) | Non-MAFC Origin Modal Distribution | Non-MAFC Destination (‘000) | Non-MAFC Destination Modal Distribution | Within MAFC (‘000) | Within MAFC Modal Distribution | Total MAFC Trade (‘000) | Total Modal Distribution |
| Truck | 321,605 | 36.3% | 313,491 | 31.4% | 3,270,109 | 83.4% | 3,905,204 | 67.2% |
| Rail | 292,402 | 33.0% | 416,916 | 41.7% | 258,727 | 6.6% | 968,044 | 16.7% |
| Water | 124,174 | 14.0% | 20,066 | 2.0% | 85,077 | 2.2% | 229,317 | 3.9% |
| Air | 545 | 0.1% | 640 | 0.1% | 99 | 0.0% | 1,284 | 0.0% |
| Multiple. Modes | 103,444 | 11.7% | 57,868 | 5.8% | 85,044 | 2.2% | 246,356 | 4.2% |
| Pipe | 33,689 | 3.8% | 183,752 | 18.4% | 172,330 | 4.4% | 389,770 | 6.7% |
| Other/ unknown | 10,547 | 1.2% | 6,649 | 0.7% | 51,098 | 1.3% | 68,294 | 1.2% |
| No Domestic mode | – | 0.0% | – | 0.0% | – | 0.0% | – | 0.0% |
| Total | 886,405 | 100.0% | 999,381 | 100.0% | 3,922,484 | 100.0% | 5,808,269 | 100.0% |
Source: Freight Analysis Framework 3.4, 2013
Table 12 displays the modal distribution based on value rather than tonnage. Value favors air, truck, and multiple modes and diminishes the role of rail and water. That being said, the proportion of freight moved by truck within the MAFC is relatively constant. We would expect trucking to stay relatively constant for within MAFC trade because it is both mover of higher valued goods and the distant between the top MAFC origin and destination pairs favors trucking.
Table 12: MAFC Modal Distribution by MAFC Imports, Exports, and Internal Movements by Value
| MAFC | Non-MAFC Origin ($millions) | Non-MAFC Origin Modal Distribution | Non-MAFC Destination ($millions) | Non-MAFC Destination Modal Distribution | Within MAFC ($millions) | Within MAFC Modal Distribution | Total MAFC Trade ($millions) | Total Modal Distribution |
| Truck | $757,435 | 59.9% | $697,317 | 57.5% | $2,330,511 | 84.2% | $3,785,264 | 72.2% |
| Rail | $125,693 | 9.9% | $93,945 | 7.8% | $92,322 | 3.3% | $311,960 | 5.9% |
| Water | $17,833 | 1.4% | $6,463 | 0.5% | $4,193 | 0.2% | $28,489 | 0.5% |
| Air | $42,062 | 3.3% | $54,576 | 4.5% | $6,097 | 0.2% | $102,735 | 2.0% |
| Multiple. Modes | $277,395 | 21.9% | $262,624 | 21.7% | $188,312 | 6.8% | $728,331 | 13.9% |
| Pipe | $15,680 | 1.2% | $74,474 | 6.1% | $86,951 | 3.1% | $177,106 | 3.4% |
| Other/ unknown | $28,864 | 2.3% | $22,296 | 1.8% | $60,396 | 2.2% | $111,556 | 2.1% |
| No Domestic mode | $- | 0.0% | $- | 0.0% | $- | 0.0% | $- | 0.0% |
| Total | $1,264,963 | 100.0% | $1,211,695 | 100.0% | $2,768,781 | 100.0% | $5,245,439 | 1 |
Source: Freight Analysis Framework 3.4, 2013
Tables 13 and 14 provide a national context for the MAFC’s modal distribution. The overall modal distribution of the MAFC largely follows the national, with a few deviations. In relative terms, the biggest difference in modal distribution is in rail transportation on both value and tonnage measures.
Table 13: MAFC vs. National Modal Distribution by Tonnage
| MAFC | Total National Tonnage (‘000) | National Modal Distribution | Total MAFC Trade (‘000) | MAFC Modal Distribution |
| Truck | 13,335,623 | 70.6% | 3,905,204 | 67.2% |
| Rail | 2,024,073 | 10.7% | 968,044 | 16.7% |
| Water | 654,950 | 3.5% | 229,317 | 3.9% |
| Air | 4,988 | 0.0% | 1,284 | 0.0% |
| Multiple. Modes | 568,082 | 3.0% | 246,356 | 4.2% |
| Pipe | 1,673,839 | 8.9% | 389,770 | 6.7% |
| Other/ unknown | 317,271 | 1.7% | 68,294 | 1.2% |
| No Domestic mode | 299,910 | 1.6% | – | 0.0% |
| Total | 18,878,735 | 100.0% | 5,808,269 | 100.0% |
Source: Freight Analysis Framework 3.4, 2013
Table 14: MAFC vs. National Modal Distribution by Value
| MAFC | Total National Value ($millions) |
National Modal Distribution | Total MAFC Trade ($millions) | MAFC Modal Distribution |
| Truck | $12,192,831 | 73.2% | $3,785,264 | 72.2% |
| Rail | $573,978 | 3.4% | $311,960 | 5.9% |
| Water | $212,000 | 1.3% | $28,489 | 0.5% |
| Air | $357,019 | 2.1% | $102,735 | 2.0% |
| Multiple. Modes | $1,917,122 | 11.5% | $728,331 | 13.9% |
| Pipe | $795,015 | 4.8% | $177,106 | 3.4% |
| Other/ unknown | $472,356 | 2.8% | $111,556 | 2.1% |
| No Domestic mode | $130,274 | 0.8% | $- | 0.0% |
| Total | $16,650,594 | 100.0% | $5,245,439 | 100% |
Source: Freight Analysis Framework 3.4, 2013
Top MAFC Commodities
The top 15 MAFC Commodities by total tonnage and value are presented in Tables 15 and 16. Tables 15 and 16 are sorted by total tonnage and value. Total was used to display the contribution of each commodity to the amount of freight traveling from MAFC origins and/or destinations. The final column of Tables 15 and 16 shows the percentage of total tonnage or value for each commodity that moves between MAFC states. The higher the percentage, the more self-reliant the MAFC is for that commodity. Conversely, a lower number either means the MAFC imports or exports a large percentage of the commodity. In total there are 43 commodities in the SCTG commodity classification, but only the top 15 are included in Tables 15 and 16. The full tables for all two digit SCTG commodity codes are available by tonnage and value in the appendix.
Table 15: Top 15 MAFC Commodities by Total Tonnage
| Rank | SCTG Commodity | SCTG Code | Non-MAFC Origin (‘000) | Non-MAFC Destination (‘000) | MAFC to MAFC (‘000) | Total (‘000) | MAFC to MAFC as % |
| 1 | Cereal grains | 2 | 170,079 | 21,081 | 634,391 | 825,550 | 77% |
| 2 | Coal | 15 | 121,082 | 331,167 | 194,578 | 646,828 | 30% |
| 3 | Gravel and crushed stone | 12 | 44,881 | 50,407 | 535,427 | 630,715 | 85% |
| 4 | Nonmetallic mineral products | 31 | 23,032 | 15,043 | 283,200 | 321,274 | 88% |
| 5 | Coal and petroleum products, n.e.c.* (includes Natural gas) | 19 | 44,839 | 124,753 | 147,880 | 317,472 | 47% |
| 6 | Waste and scrap | 41 | 19,303 | 9,061 | 280,668 | 309,032 | 91% |
| 7 | Base metal in primary or semi-finished forms and in finished basic shapes | 32 | 39,629 | 36,726 | 142,080 | 218,435 | 65% |
| 8 | Other prepared foodstuffs and fats and oils | 7 | 43,221 | 25,258 | 120,376 | 188,855 | 64% |
| 9 | Gasoline and aviation turbine fuel | 17 | 3,491 | 5,479 | 164,321 | 173,291 | 95% |
| 10 | Natural sands | 11 | 14,910 | 1,847 | 150,506 | 167,264 | 90% |
| 11 | Other agricultural products | 3 | 45,915 | 15,000 | 100,218 | 161,133 | 62% |
| 12 | Crude petroleum | 16 | 5,047 | 80,136 | 61,000 | 146,183 | 42% |
| 13 | Animal feed and products of animal origin, n.e.c. | 4 | 37,238 | 7,514 | 84,937 | 129,688 | 65% |
| 14 | Basic chemicals | 20 | 20,432 | 35,267 | 62,190 | 117,890 | 53% |
| 15 | Fuel oils | 18 | 9,212 | 5,129 | 103,056 | 117,397 | 88% |
Source: Freight Analysis Framework 3.4, 2013
Table 16 presents the top 15 commodities by value for the MAFC. The commodities are ranked to highest total tonnage and a full list of commodities by value for the MAFC is available in the appendix. The commodities designated as the top 15 by value is almost a completely new list compared to that of tonnage. In fact, there are only 4 duplicate commodities in the list; other prepared foodstuffs and fats and oils, gasoline and aviation turbine fuel, coal and petroleum products (includes Natural gas), and base metal in primary or semi-finished forms and in finished basic shapes.
Table 16: Top 15 MAFC Commodities by Total Value
| Rank | SCTG Commodity | SCTG Code | Non-MAFC Origin ($millions) | Non-MAFC Destination ($millions) | MAFC-MACF ($millions) | Total ($millions) | MAFC to MAFC as % |
| 1 | Motorized and other vehicles (including parts) | 36 | $204,753 | $105,727 | $325,957 | $636,436 | 51% |
| 2 | Machinery | 34 | $112,988 | $103,065 | $318,599 | $534,651 | 60% |
| 3 | Electronic and other electrical equipment and components and office equipment | 35 | $113,648 | $152,750 | $141,359 | $407,757 | 35% |
| 4 | Mixed freight | 43 | $50,582 | $34,185 | $213,335 | $298,102 | 72% |
| 5 | Pharmaceutical products | 21 | $49,244 | $93,337 | $125,869 | $268,450 | 47% |
| 6 | Base metal in primary or semi-finished forms and in finished basic shapes | 32 | $54,803 | $62,747 | $143,614 | $261,164 | 55% |
| 7 | Plastics and rubber | 24 | $61,115 | $62,005 | $98,141 | $221,262 | 44% |
| 8 | Miscellaneous manufactured products | 40 | $60,098 | $59,857 | $76,248 | $196,203 | 39% |
| 9 | Other prepared foodstuffs and fats and oils | 7 | $45,369 | $35,071 | $114,797 | $195,236 | 59% |
| 10 | Articles of base metal | 33 | $43,482 | $41,455 | $109,255 | $194,192 | 56% |
| 11 | Textiles, leather, and articles of textiles or leather | 30 | $47,979 | $61,211 | $65,404 | $174,594 | 37% |
| 12 | Chemical products and preparations, n.e.c.* | 23 | $49,340 | $34,055 | $69,890 | $153,285 | 46% |
| 13 | Precision instruments and apparatus | 38 | $39,784 | $43,853 | $42,713 | $126,349 | 34% |
| 14 | Gasoline and aviation turbine fuel | 17 | $2,436 | $3,975 | $113,573 | $119,985 | 95% |
| 15 | Coal and petroleum products, n.e.c.* (includes Natural gas) | 19 | $19,344 | $51,849 | $47,174 | $118,367 | 40% |
Source: Freight Analysis Framework 3.4, 201
Conclusion
The MAFC is clearly a multi-modal region that is heavily reliant on itself as shown by total trade within the region. This section outlines the trade flows of the MAFC by splitting the FAF 3.4 into sub-populations differentiated based on MAFC membership, mode, commodity, value, and tonnage. The freight story of the MAFC is multi-faceted as shown by the definitive differences between the same variables shown in tonnage and value terms. Similarly, the modal distribution of freight moves in the MAFC depends greatly on if the moves are within the MAFC or if they have a non-MAFC origin or destination. This section of the RFS is a high-level snapshot of the MAFC and its use of the freight system. Subsequent sections will provide more specific analysis of freight movements.
Note: All of the tables on this page are available for download in a single Excel spreadsheet.