While the trucking industry is the top transporter of freight in the MAFC and the United States, water transportation plays a vital role in the transportation of heavier bulk commodities. The MAFC uses the inland waterways and the Great Lakes to ship and receive goods regionally and to reach international markets through the Mississippi River and the St. Lawrence Seaway. Water transportation exhibits an extreme competitive advantage in the transport of heavy bulk goods over long distances. For example, a standard dry cargo barge has the carrying capacity of 70 trucks or 2 unit trains. Furthermore, inland marine transportation gets 576 ton-miles per gallon of fuel compared to 413 for rail and 155 for truck.
The MAFC has access to 5,610 miles of navigable waterways which constitutes 22.2 percent of inland waterways (Inland Waterway Mileage: 2008, nd). Furthermore, the MAFC is the largest user of the Great Lakes to move freight. The inland waterways and the Great Lakes support thousands of ports that ship and receive various amounts of tonnages. In order to place port usages into a national context this study will compare the total tonnages of MAFC ports to the top 150 ports in the United States. Table 1 shows that of the Great Lakes ports that are in the top 150 national ports ranked by tonnage. The MAFC has all but one of the Great Lakes ports that are ranked in the top 150 ports by tonnage for 2010. In a regional and national context, when the Great Lakes are referred to as a freight asset, it is almost exclusively an advantage for the MAFC.
Table 1: US Great Lakes Ports in a National Context
| Port | US Rank | Total (‘000 Tons) | Domestic (‘000 Tons) | Foreign (‘000 Tons) | Imports (‘000 Tons) | Exports (‘000 Tons) |
| Duluth-Superior, MN and WI | 18 | 36,598 | 26,936 | 9,662 | 331 | 9,331 |
| Chicago, IL | 37 | 18,534 | 15,382 | 3,152 | 2,080 | 1,073 |
| Two Harbors, MN | 42 | 13,877 | 13,392 | 486 | 17 | 468 |
| Detroit, MI | 43 | 13,406 | 10,793 | 2,614 | 2,414 | 200 |
| Cleveland, OH | 48 | 10,791 | 9,218 | 1,573 | 1,509 | 64 |
| Toledo, OH | 49 | 10,720 | 3,927 | 6,793 | 3,804 | 2,989 |
| Indiana Harbor, IN | 50 | 10,169 | 9,902 | 267 | – | 267 |
| Presque Isle, MI | 55 | 8,721 | 6,447 | 2,273 | 17 | 2,257 |
| St. Clair, MI | 58 | 7,988 | 7,988 | – | – | – |
| Gary, IN | 59 | 7,831 | 7,608 | 223 | 165 | 58 |
| Ashtabula, OH | 65 | 6,346 | 3,811 | 2,535 | 1,313 | 1,222 |
| Silver Bay, MN | 66 | 6,191 | 6,139 | 52 | – | 52 |
| Burns Waterway Harbor, IN | 68 | 6,055 | 5,670 | 385 | 257 | 128 |
| Stoneport, MI | 69 | 5,649 | 5,138 | 511 | 3 | 507 |
| Calcite, MI | 74 | 4,760 | 4,199 | 562 | 10 | 551 |
| Escanaba, MI | 76 | 4,736 | 4,524 | 212 | 46 | 165 |
| Port Inland, MI | 77 | 4,695 | 4,373 | 321 | – | 321 |
| Conneaut, OH | 80 | 3,558 | 3,415 | 143 | 143 | – |
| Port Dolomite, MI | 84 | 3,249 | 2,703 | 546 | – | 546 |
| Marblehead, OH | 92 | 2,588 | 2,170 | 418 | 49 | 369 |
| Milwaukee, WI | 96 | 2,435 | 1,323 | 1,112 | 997 | 115 |
| Monroe, MI | 97 | 2,413 | 2,401 | 12 | 12 | – |
| Sandusky, OH | 99 | 2,304 | 990 | 1,314 | 36 | 1,278 |
| Alpena, MI | 101 | 2,148 | 1,928 | 220 | 88 | 132 |
| Green Bay, WI | 109 | 1,910 | 1,752 | 157 | 157 | – |
| Fairport Harbor, OH | 117 | 1,498 | 1,232 | 267 | 192 | 75 |
| Muskegon, MI | 118 | 1,479 | 1,325 | 154 | 154 | – |
| Buffalo, NY | 126 | 1,298 | 611 | 687 | 376 | 312 |
| Buffington, IN | 129 | 1,128 | 866 | 263 | 263 | – |
| Drummond Island, MI | 131 | 1,069 | 795 | 274 | – | 274 |
| Marquette, MI | 136 | 1,010 | 793 | 216 | 216 | – |
| Lorain, OH | 144 | 853 | 645 | 208 | 128 | 80 |
| Grand Haven, MI | 146 | 763 | 696 | 67 | 67 | – |
| Huron, OH | 150 | 717 | 717 | – | – | – |
Source: WATERBORNE COMMERCE OF THE UNITED STATES, 2010
On a state-by-state basis the MAFC is well represented in total water-based freight compared to the rest of the United States. Table 2 places MAFC states in a larger national comparison by totaling state water-based freight and comparing the MAFC to the United States. Aggregating the MAFC states into a total waterborne tonnage requires more than a summation, because all intra-MAFC tonnage would be counted twice. For the purposes of this comparison, the total adjusted MAFC tonnage is 356 billion tons.
Table 2: All Water-based Freight in a National Context by State
| Domestic | Foreign | ||||||
| State | Shipping (‘000 tons) | Receiving (‘000 tons) | Intrastate (‘000 tons) | Shipping (‘000 tons) | Receiving (‘000 tons) | Total Tonnage (‘000 tons) | US Rank |
| Illinois | 79,209 | 14,725 | 10,996 | 1,073 | 2,080 | 108,083 | 6 |
| Ohio | 19,996 | 55,198 | 10,488 | 6,131 | 7,174 | 98,986 | 8 |
| Kentucky | 46,032 | 26,646 | 18,679 | 0 | 0 | 91,357 | 9 |
| Indiana | 15,613 | 41,041 | 3,013 | 454 | 684 | 60,805 | 14 |
| Michigan | 18,374 | 21,225 | 10,059 | 5,283 | 4,127 | 59,067 | 15 |
| Minnesota | 28,079 | 6,907 | 994 | 4,261 | 167 | 40,408 | 20 |
| Wisconsin | 21,184 | 5,852 | 231 | 5,704 | 1,523 | 34,494 | 22 |
| Missouri | 22,308 | 5,352 | 5,293 | 0 | 0 | 32,953 | 24 |
| Iowa | 6,958 | 2,712 | 800 | 0 | 0 | 10,470 | 33 |
| Kansas | 232 | 7 | 0 | 0 | 0 | 239 | 39 |
Source: WATERBORNE COMMERCE OF THE UNITED STATES, 2010
Going beyond the navigable waterway network and the tonnage it moves, it is important to consider the support businesses for the maritime freight industry. Figure 1 displays the navigable waterways and the Great Lakes shipping routes from the US Army Corps of Engineers and water-related businesses in the MAFC. The data reported is the result of a query of ESRI’s Business Analyst data set. The businesses selected are constrained to companies that move freight by water and does not include support industries like barge or tug repair, dredging companies, or port construction.
Figure 1: Water Infrastructure and Related Businesses in the MAFC
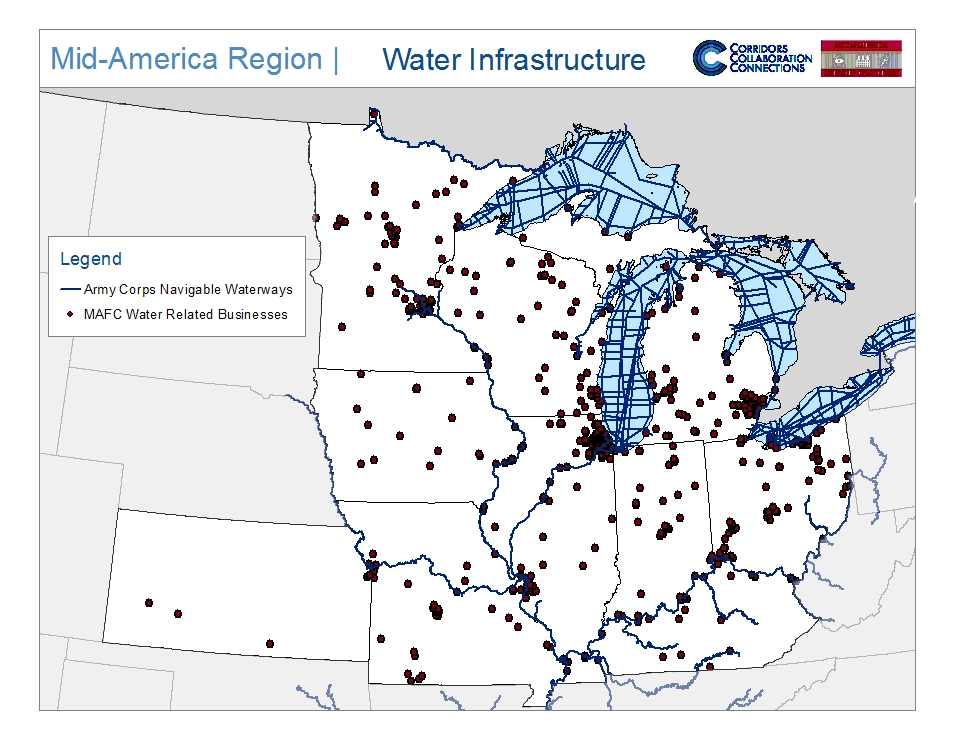
Source: Esri Business Analyst, 2011
Table 3 displays the number of businesses and total employment by state and for the MAFC as a whole for maritime freight. The maritime freight industry, as expected, has fewer businesses and employees than the trucking industry. The explanation of lower maritime employment is twofold; first, the total tonnage moved by water is lower than trucking. Also, there is a theoretical argument for water transportation relying on labor less than trucking and being more reliant on capital. Unfortunately, the Bureau of Labor Statistics does not collect labor productivity data on the maritime freight industry.
Table 3: Maritime Freight-related Businesses
| State | Water Freight Employment | Number of Water Freight Businesses | Total State Employment | Total State Businesses |
| Illinois | 1,082 | 122 | 5,884,453 | 476,575 |
| Indiana | 539 | 39 | 2,938,335 | 222,320 |
| Iowa | 186 | 28 | 1,607,190 | 136,378 |
| Kansas | 40 | 8 | 1,407,272 | 123,790 |
| Kentucky | 638 | 25 | 1,819,898 | 153,924 |
| Michigan | 272 | 81 | 4,305,125 | 371,368 |
| Minnesota | 289 | 73 | 2,888,004 | 221,993 |
| Missouri | 430 | 44 | 2,883,801 | 239,690 |
| Ohio | 364 | 75 | 5,634,785 | 413,878 |
| Wisconsin | 227 | 54 | 3,063,309 | 244,656 |
| MAFC | 4,067 | 549 | 32,432,172 | 2,604,572 |
Source: Esri Business Analyst, 2011