The road network supports the greatest amount of freight as measured by tons and value. As an important mode for interstate goods movements, intermodal trade, and last mile deliveries, the road network is vitally important to the MAFC. Using the Freight Analysis Framework (FAF) 3.4 to determine tonnage transported by truck, states in the MAFC transport anywhere from 54-79 percent of tonnage annually by truck (Table 1). The MAFC as a region transports 3.91 billion tons of freight or 67 percent of total tonnage annually via truck.[1]
Table 1: Truck Tonnage by MAFC State
| Origin (‘000 Tons) | Destination (‘000 Tons) | Within (‘000 Tons) | Total (‘000 Tons) | Truck Tonnage as % of Total | |
| Illinois | 626,584 | 641,540 | 488,538 | 779,586 | 62% |
| Indiana | 397,816 | 390,292 | 282,052 | 506,056 | 73% |
| Iowa | 327,649 | 304,511 | 263,324 | 368,836 | 79% |
| Kansas | 223,937 | 209,931 | 168,051 | 265,818 | 70% |
| Kentucky | 258,847 | 271,589 | 204,510 | 325,925 | 54% |
| Michigan | 351,128 | 358,858 | 271,044 | 438,943 | 68% |
| Minnesota | 305,022 | 310,943 | 248,607 | 367,357 | 59% |
| Missouri | 321,904 | 329,671 | 250,374 | 401,201 | 71% |
| Ohio | 505,145 | 496,803 | 385,755 | 616,194 | 68% |
| Wisconsin | 273,682 | 269,461 | 205,697 | 337,447 | 74% |
Source: Freight Analysis Framework 3.4, 2013
The MAFC supports 29.5 percent of the total road miles in the United States and has 24.5 percent of the total interstate system miles. Total miles and the total interstate miles are both important indicators of access and of the main carriers of freight. Table 2 shows the total road miles and interstate miles per state and compares each state to the MAFC and to the nation as a whole.
Table 2: Road Miles by State Compared to MAFC and Nation
| State | Total Miles | Miles as % of MAFC | Miles as % of Nation | Total Interstate Miles | Interstate as % of MAFC | Interstate as % of Nation |
| Illinois | 139,498 | 11.6% | 3.4% | 2,182 | 19.0% | 4.6% |
| Indiana | 97,066 | 8.1% | 2.4% | 1,172 | 10.2% | 2.5% |
| Iowa | 114,387 | 9.5% | 2.8% | 782 | 6.8% | 1.7% |
| Kansas | 140,513 | 11.7% | 3.4% | 874 | 7.6% | 1.9% |
| Kentucky | 79,220 | 6.6% | 1.9% | 801 | 7.0% | 1.7% |
| Michigan | 122,086 | 10.2% | 3.0% | 1,244 | 10.8% | 2.6% |
| Minnesota | 138,702 | 11.5% | 3.4% | 914 | 8.0% | 1.9% |
| Missouri | 131,667 | 11.0% | 3.2% | 1,206 | 10.5% | 2.6% |
| Ohio | 123,247 | 10.3% | 3.0% | 1,574 | 13.7% | 3.4% |
| Wisconsin | 115,018 | 9.6% | 2.8% | 742 | 6.5% | 1.6% |
| MAFC Total | 1,201,404 | 100.0% | 29.5% | 11,491 | 100.0% | 24.5% |
Source: PUBLIC ROAD AND STREET LENGTH, 1980 – 2011
Going beyond the overall count of the miles of road, it is important to consider the support businesses for the freight trucking industry. Figure 1 displays the MAFC’s trucking related industries. The businesses selected are constrained to companies that transport freight by truck. Therefore, the data does not include support industries like truck repair, towing, or the building of semi-trucks. As expected the trucking companies are congregated around population centers, but are distributed throughout the MAFC.
Figure 1: Trucking Businesses in the MAFC
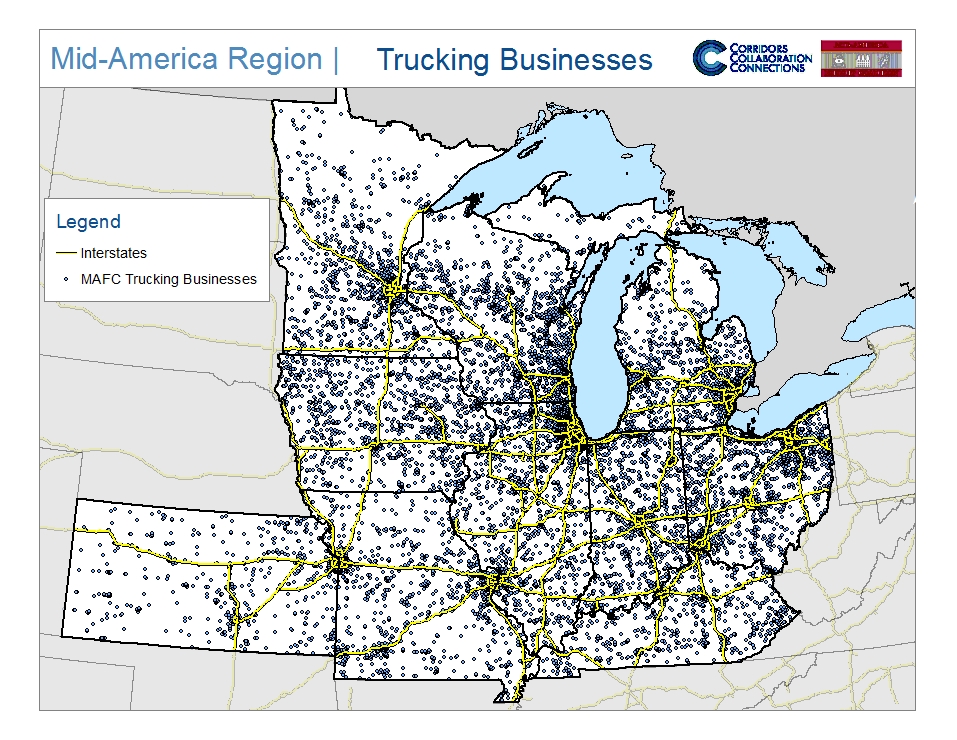

Source: Esri Business Analyst, 2011
Table 2 displays the aggregate state and MAFC statistics behind Figure 1. In most cases the employment and the number of businesses are around 1 percent of their respective state totals, as it was focused on just trucking companies. Therefore, it is important to consider all of the support industries that are used as inputs for the trucking industry and all the businesses that service trucks.
Table 3: Trucking Business and Employment by State and MAFC
| Trucking Employment | Number of Trucking Businesses | Total State Employment | Total State Businesses | |
| Illinois | 67,951 | 4,419 | 5,884,453 | 476,575 |
| Indiana | 32,638 | 1,967 | 2,938,335 | 222,320 |
| Iowa | 27,310 | 1,659 | 1,607,190 | 136,378 |
| Kansas | 16,457 | 1,058 | 1,407,272 | 123,790 |
| Kentucky | 22,450 | 1,267 | 1,819,898 | 153,924 |
| Michigan | 30,470 | 2,449 | 4,305,125 | 371,368 |
| Minnesota | 22,803 | 1,805 | 2,888,004 | 221,993 |
| Missouri | 34,925 | 2,088 | 2,883,801 | 239,690 |
| Ohio | 56,807 | 3,434 | 5,634,785 | 413,878 |
| Wisconsin | 36,495 | 2,430 | 3,063,309 | 244,656 |
| MAFC | 348,306 | 22,576 | 32,432,172 | 2,604,572 |
Source: Esri Business Analyst, 2011
[1] It is important to note that adding individual MAFC states will not add to a correct total tonnage for any mode, because of double counting. Double counting will be a reoccurring problem for determining total MAFC trade because tonnages and value are calculated by adding total trade by origin and destination. In the case of inter-MAFC trade, tonnages both originate and are destined for the MAFC and are counted twice if aggregate state totals are summed to reach a MAFC total.